Insights
Insights answers questions about the fleet rather than about one incident: where the noise is, whether investigations are reaching conclusions, and which clusters are unstable.
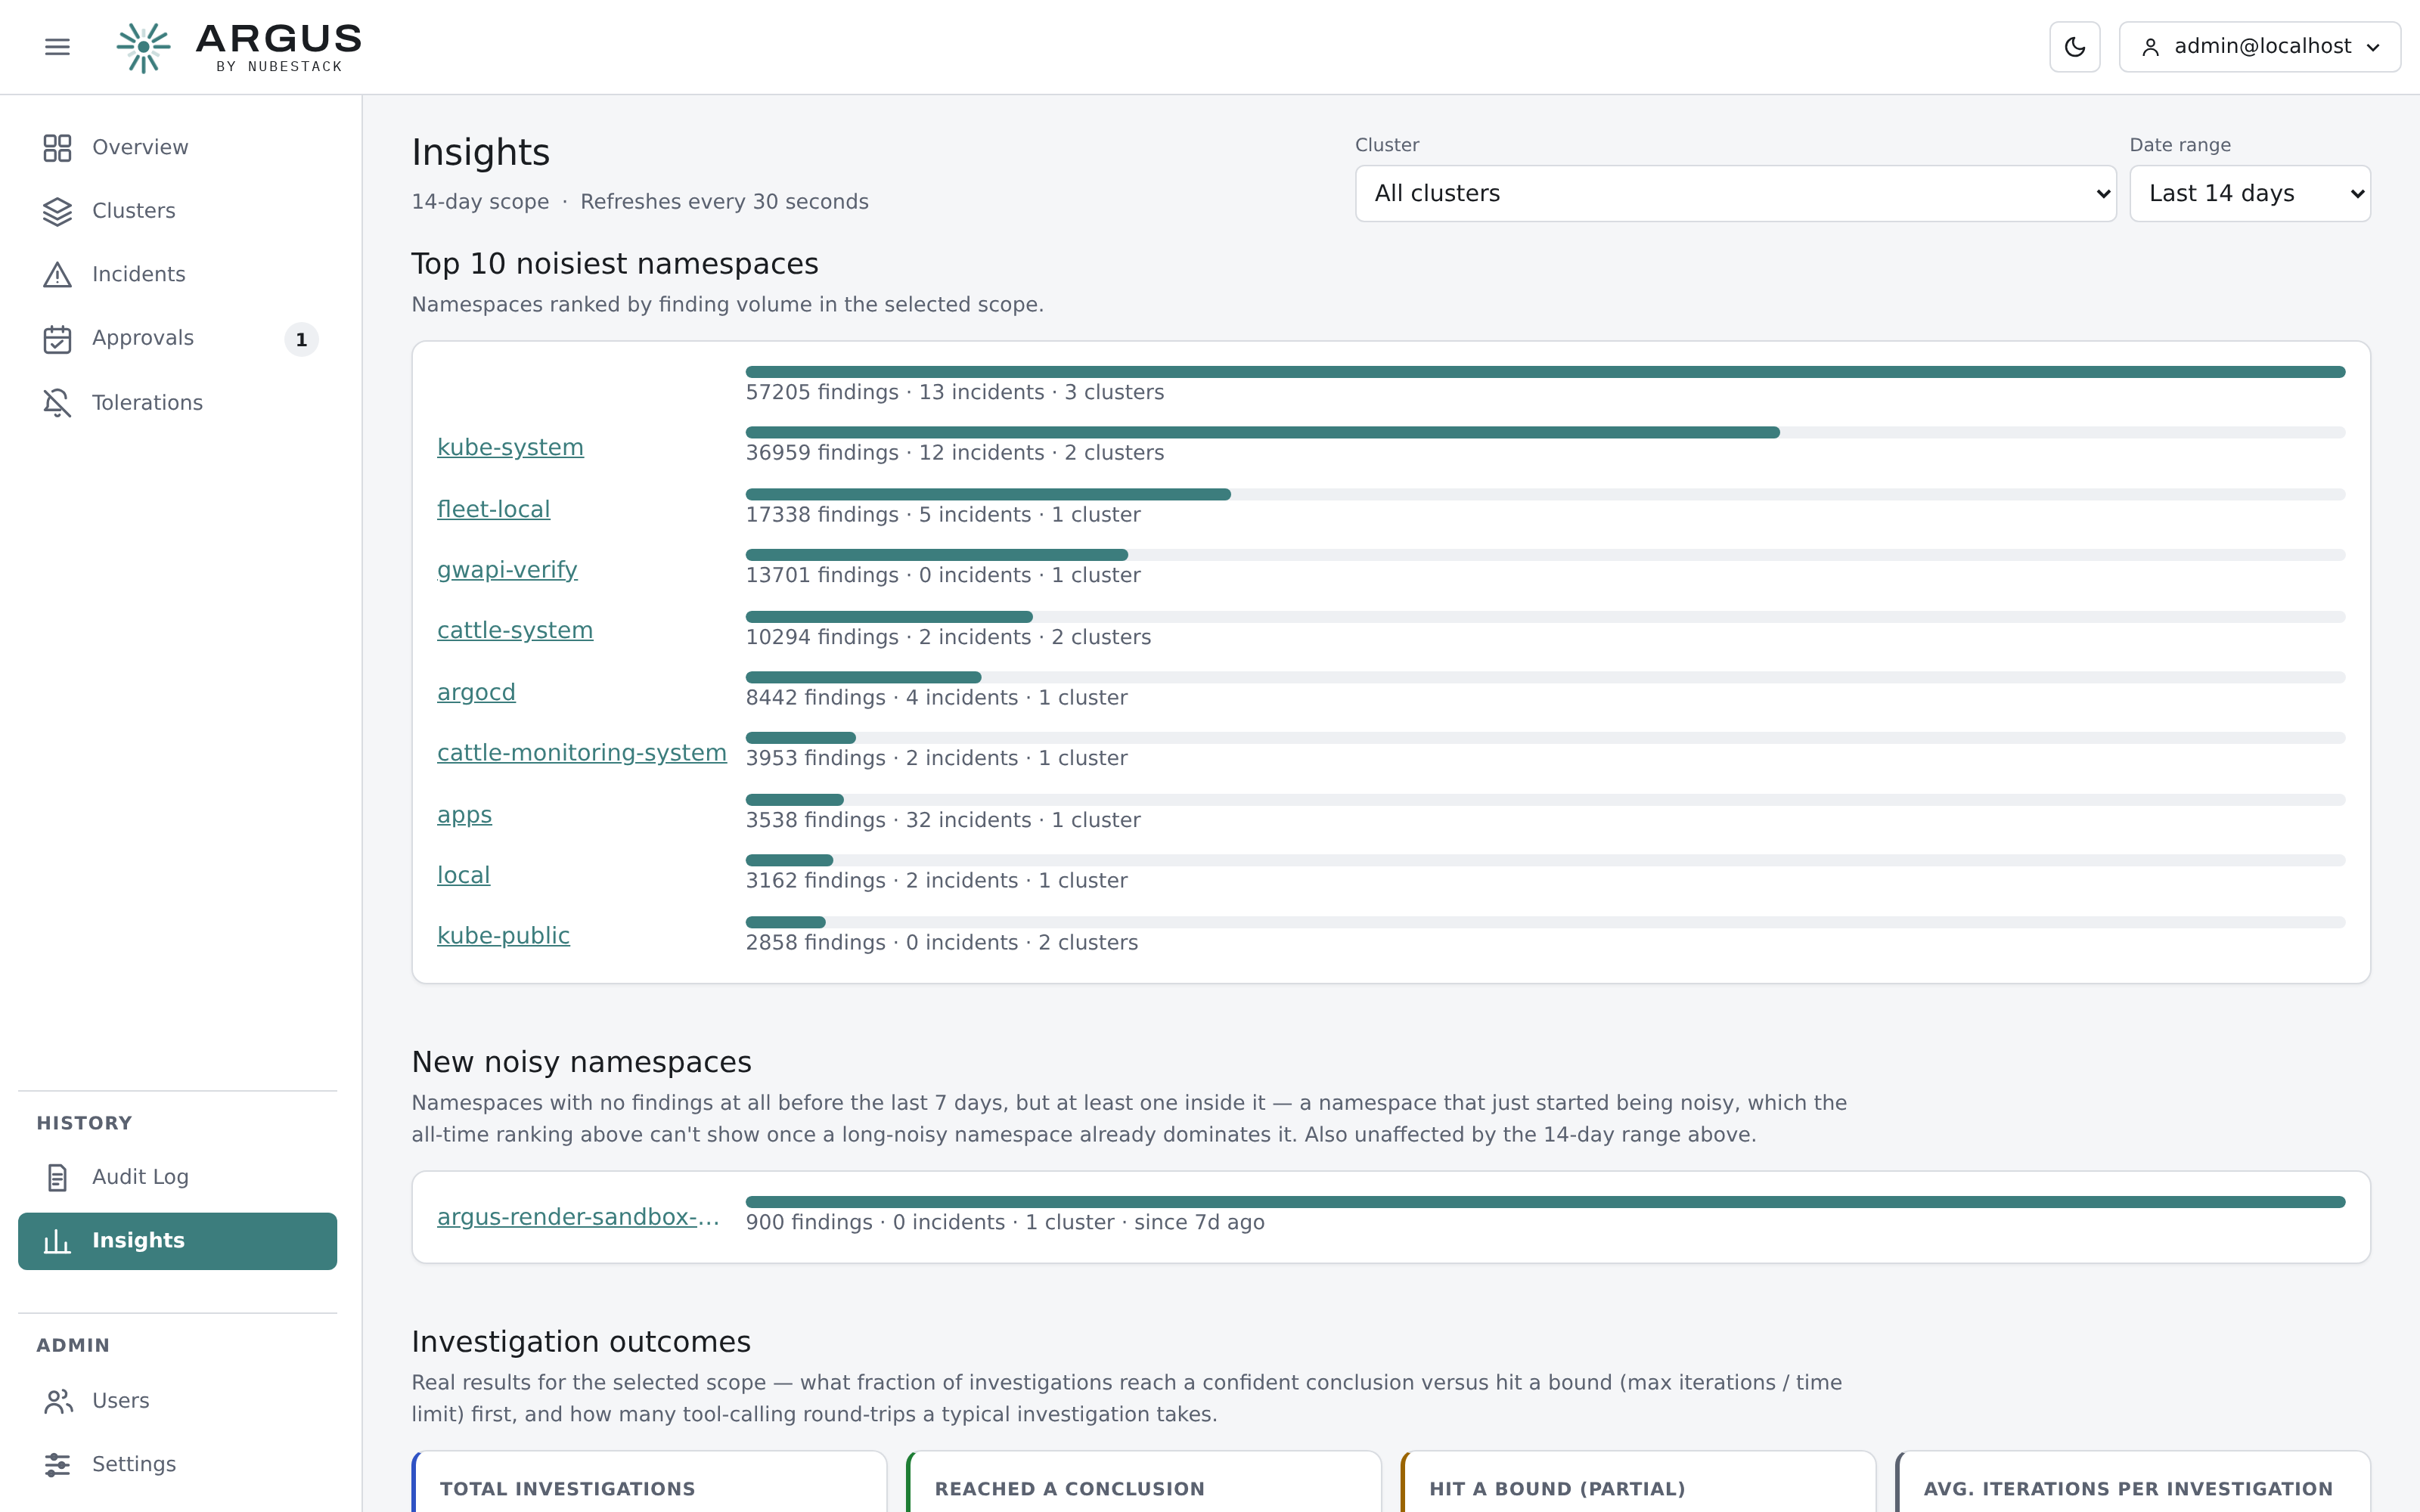
Every figure is computed from real recorded data for the selected scope. Nothing is extrapolated or estimated.
Scope
Pick a cluster or the whole fleet, and a date range of 14, 30 or 90 days. The page refreshes every 30 seconds.
What it shows
Noisiest namespaces. Namespaces ranked by finding volume, with the incident count and how many clusters each appears in. This is where to look before tuning detectors: a single namespace often accounts for most of the volume.
Newly noisy namespaces. Namespaces with no findings at all before the last week and at least one inside it. An all-time ranking cannot show this — a long-noisy namespace dominates it permanently — so a namespace that has just started misbehaving gets its own list.
Investigation outcomes. What fraction of investigations reached a conclusion, proposed a plan, or stopped without one. This is the honest measure of whether analysis is working on your estate, and it is worth checking after changing model or provider.
Unstable clusters. Clusters ranked by reopened and failed incidents rather than by open count, which surfaces somewhere that fixes are not holding.
Using it
Insights is the page to read monthly rather than during an incident.
If the queue feels noisy, start with the noisiest namespaces and decide per namespace whether the condition is real, accepted, or a detector that wants disabling.
If investigations are frequently stopping without a conclusion, look at the investigation bounds and the model before concluding the estate is unusual.
If a cluster shows repeated reopenings, the fixes are not holding, and the incidents themselves will say which class of fault is recurring.