Certificates, upgrades and posture
Three tabs on the cluster page look ahead rather than at what is broken now: what expires, what would break on the next Kubernetes version, and which settings carry risk. A fourth, Cost, shows what the cluster spends.
Certificates
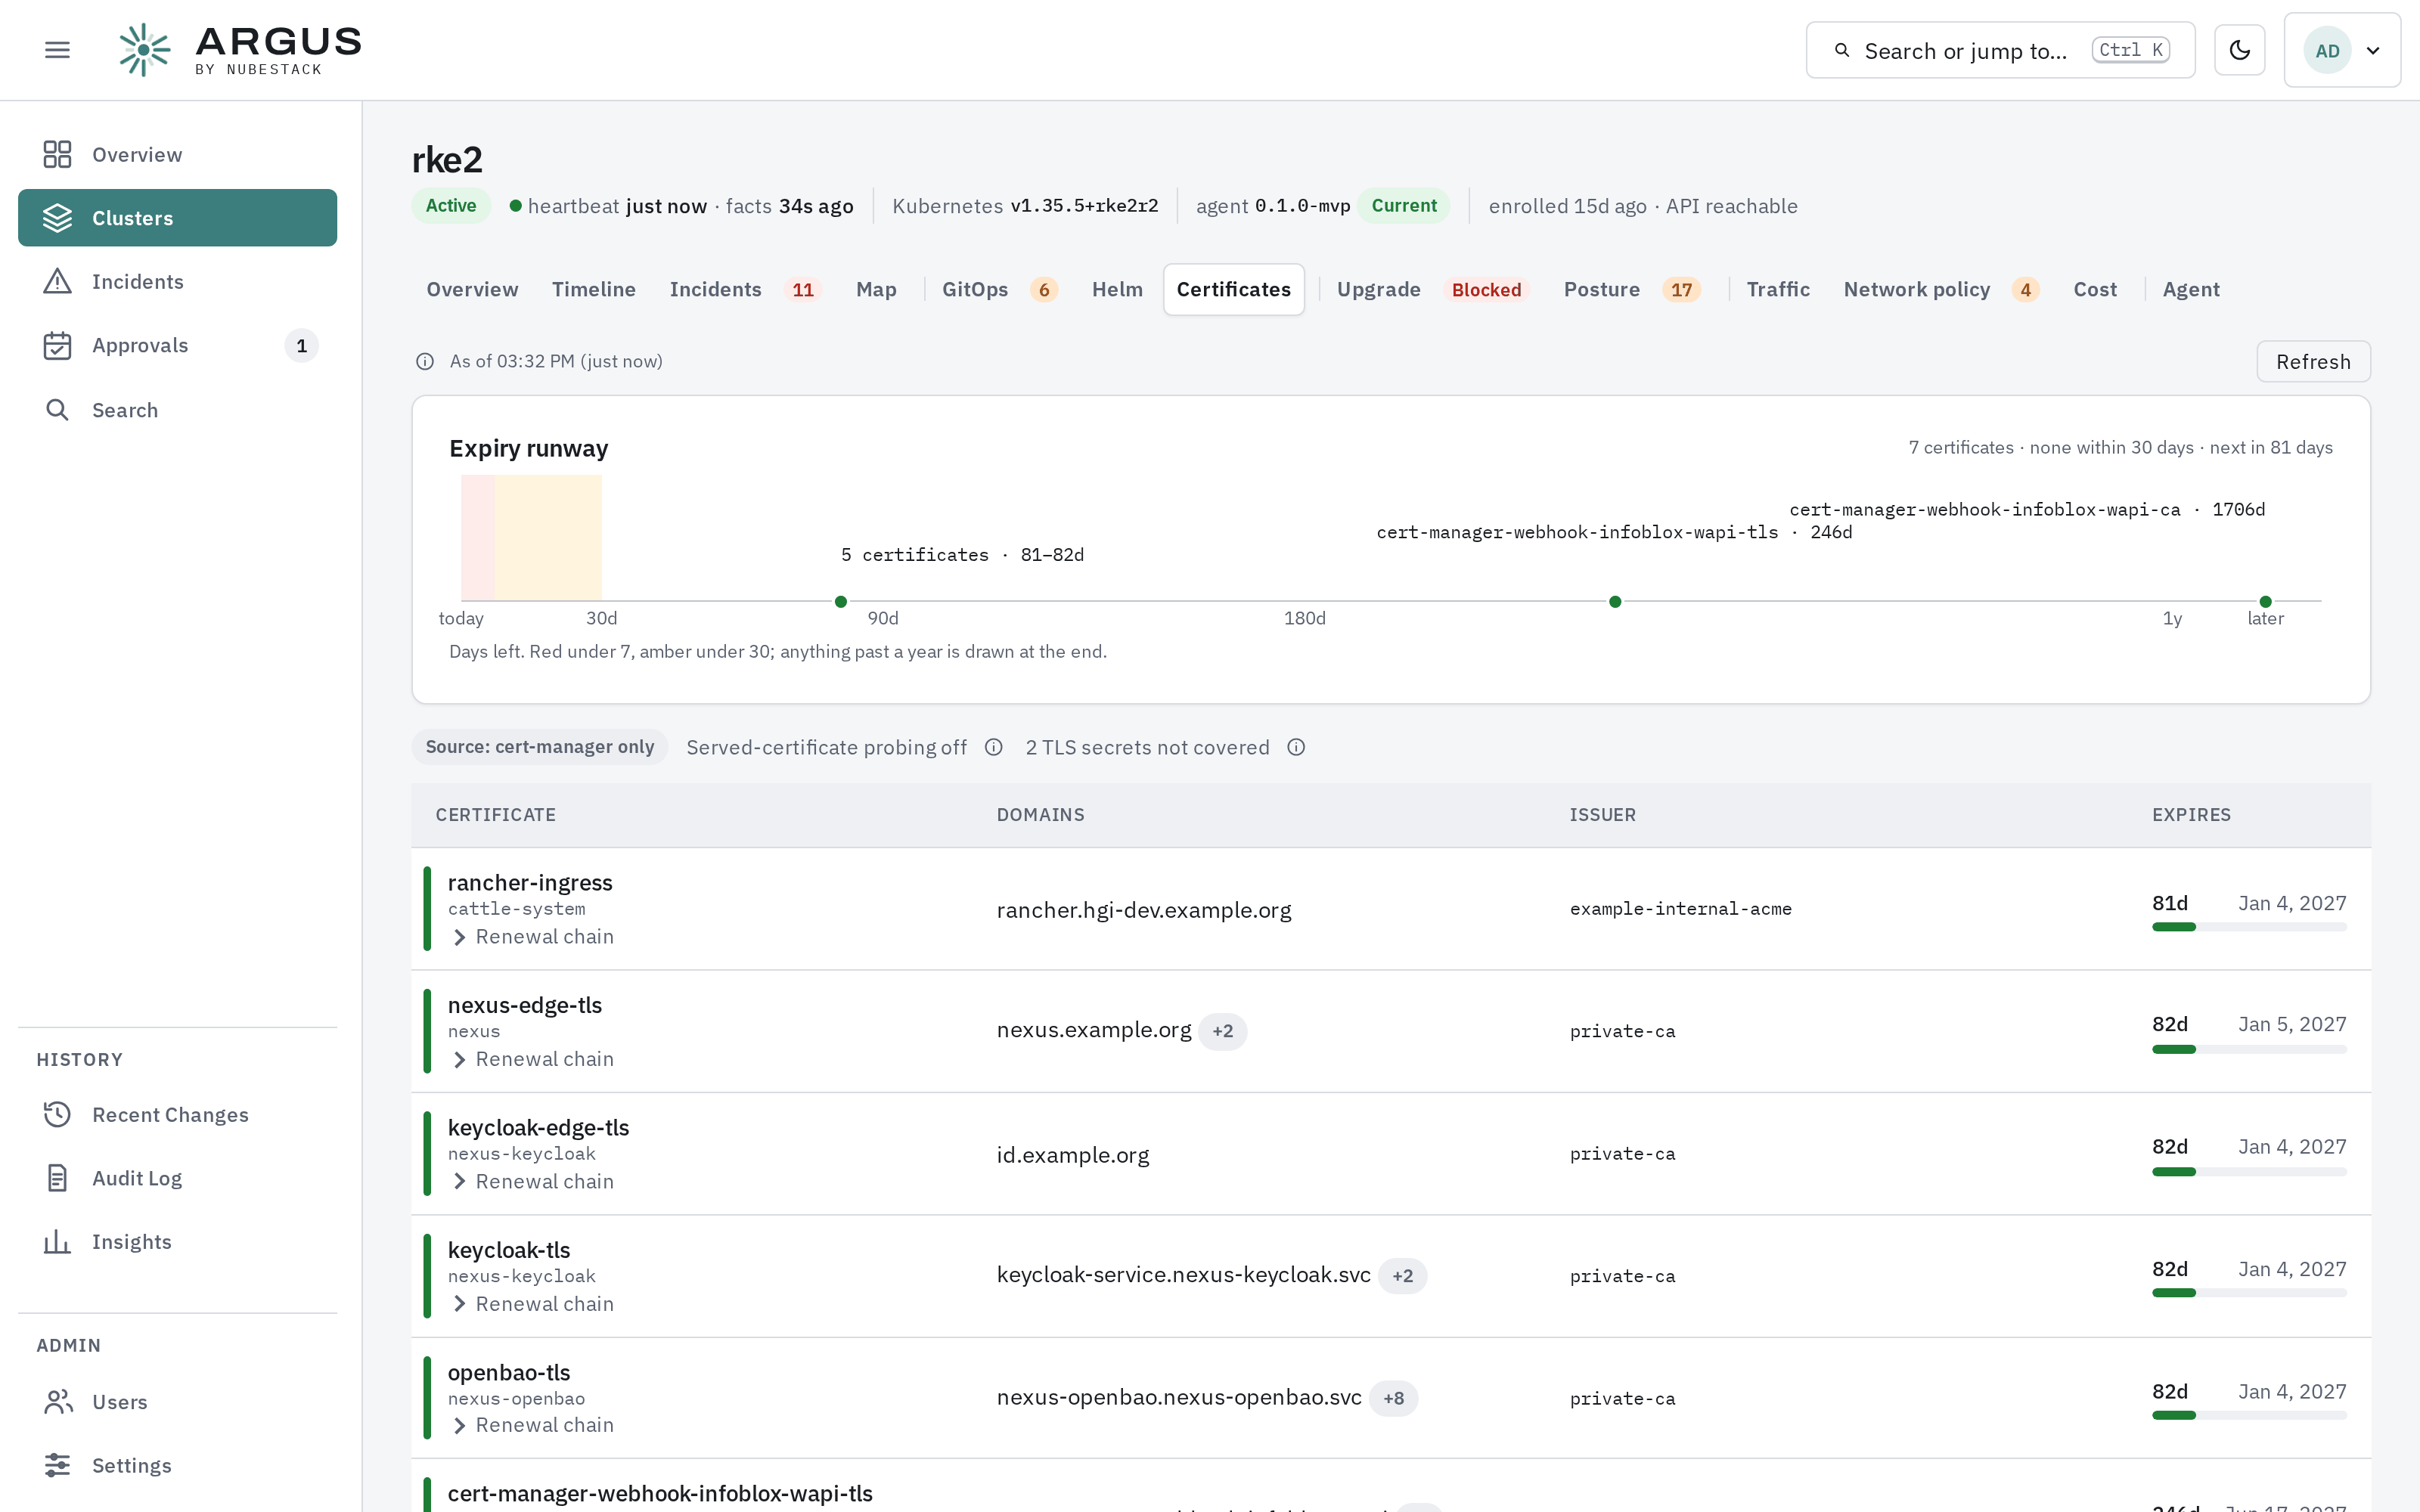
Every certificate on one axis from today to a year out, with the unhealthy and degraded thresholds drawn as zones.
The runway puts each certificate at its expiry, so anything close stands out. The table lists each certificate with its domains, issuer and expiry; expand one for its renewal chain.
Certificates are read from cert-manager's own records. TLS Secrets are never opened, so certificates held only in Secrets are counted as not covered rather than read. Checking the certificates your services actually present is off by default.
Upgrade
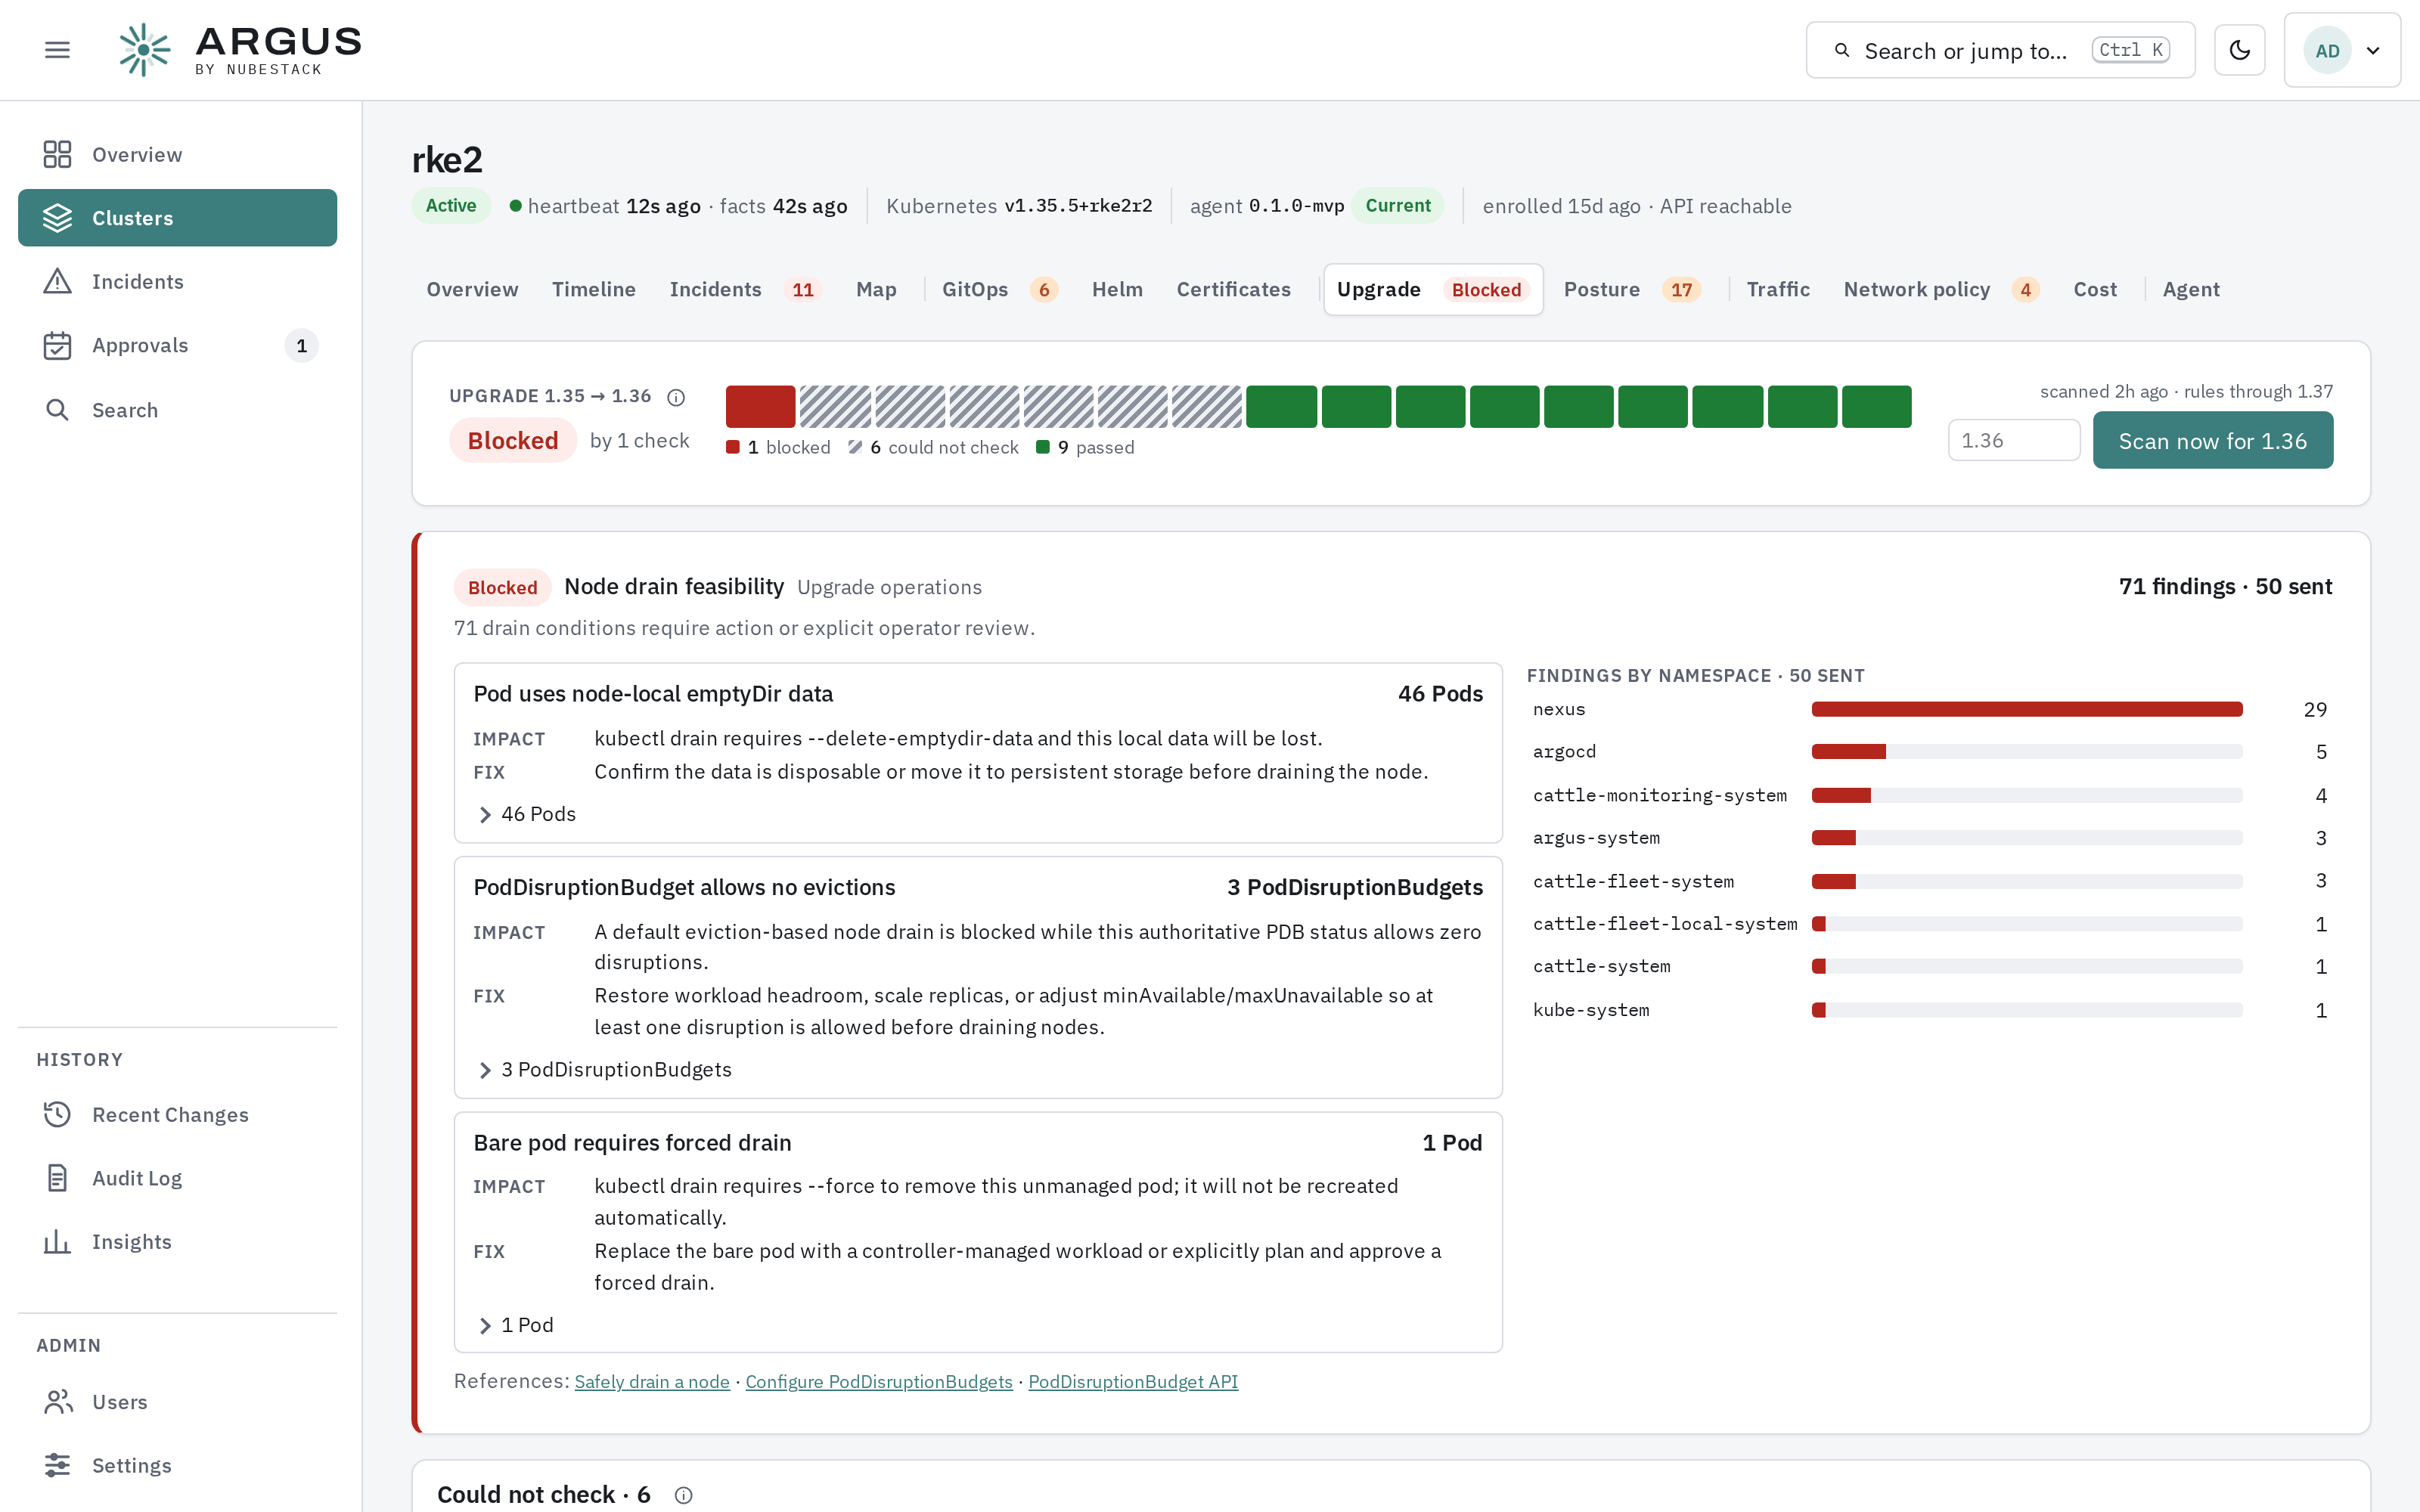
One verdict for the target version, then each blocking finding with its impact, its fix and the documentation behind it.
Choose a target version and Scan. The strip shows how many checks block the upgrade, how many could not be checked, and how many passed. Each finding says what breaks, how to fix it, and links the Kubernetes documentation it rests on — removed APIs still in use, workloads that cannot be drained, settings the new version rejects. Findings are also counted by namespace.
The scan is read-only. The checks cover Kubernetes versions through the one stated on the tab.
Posture
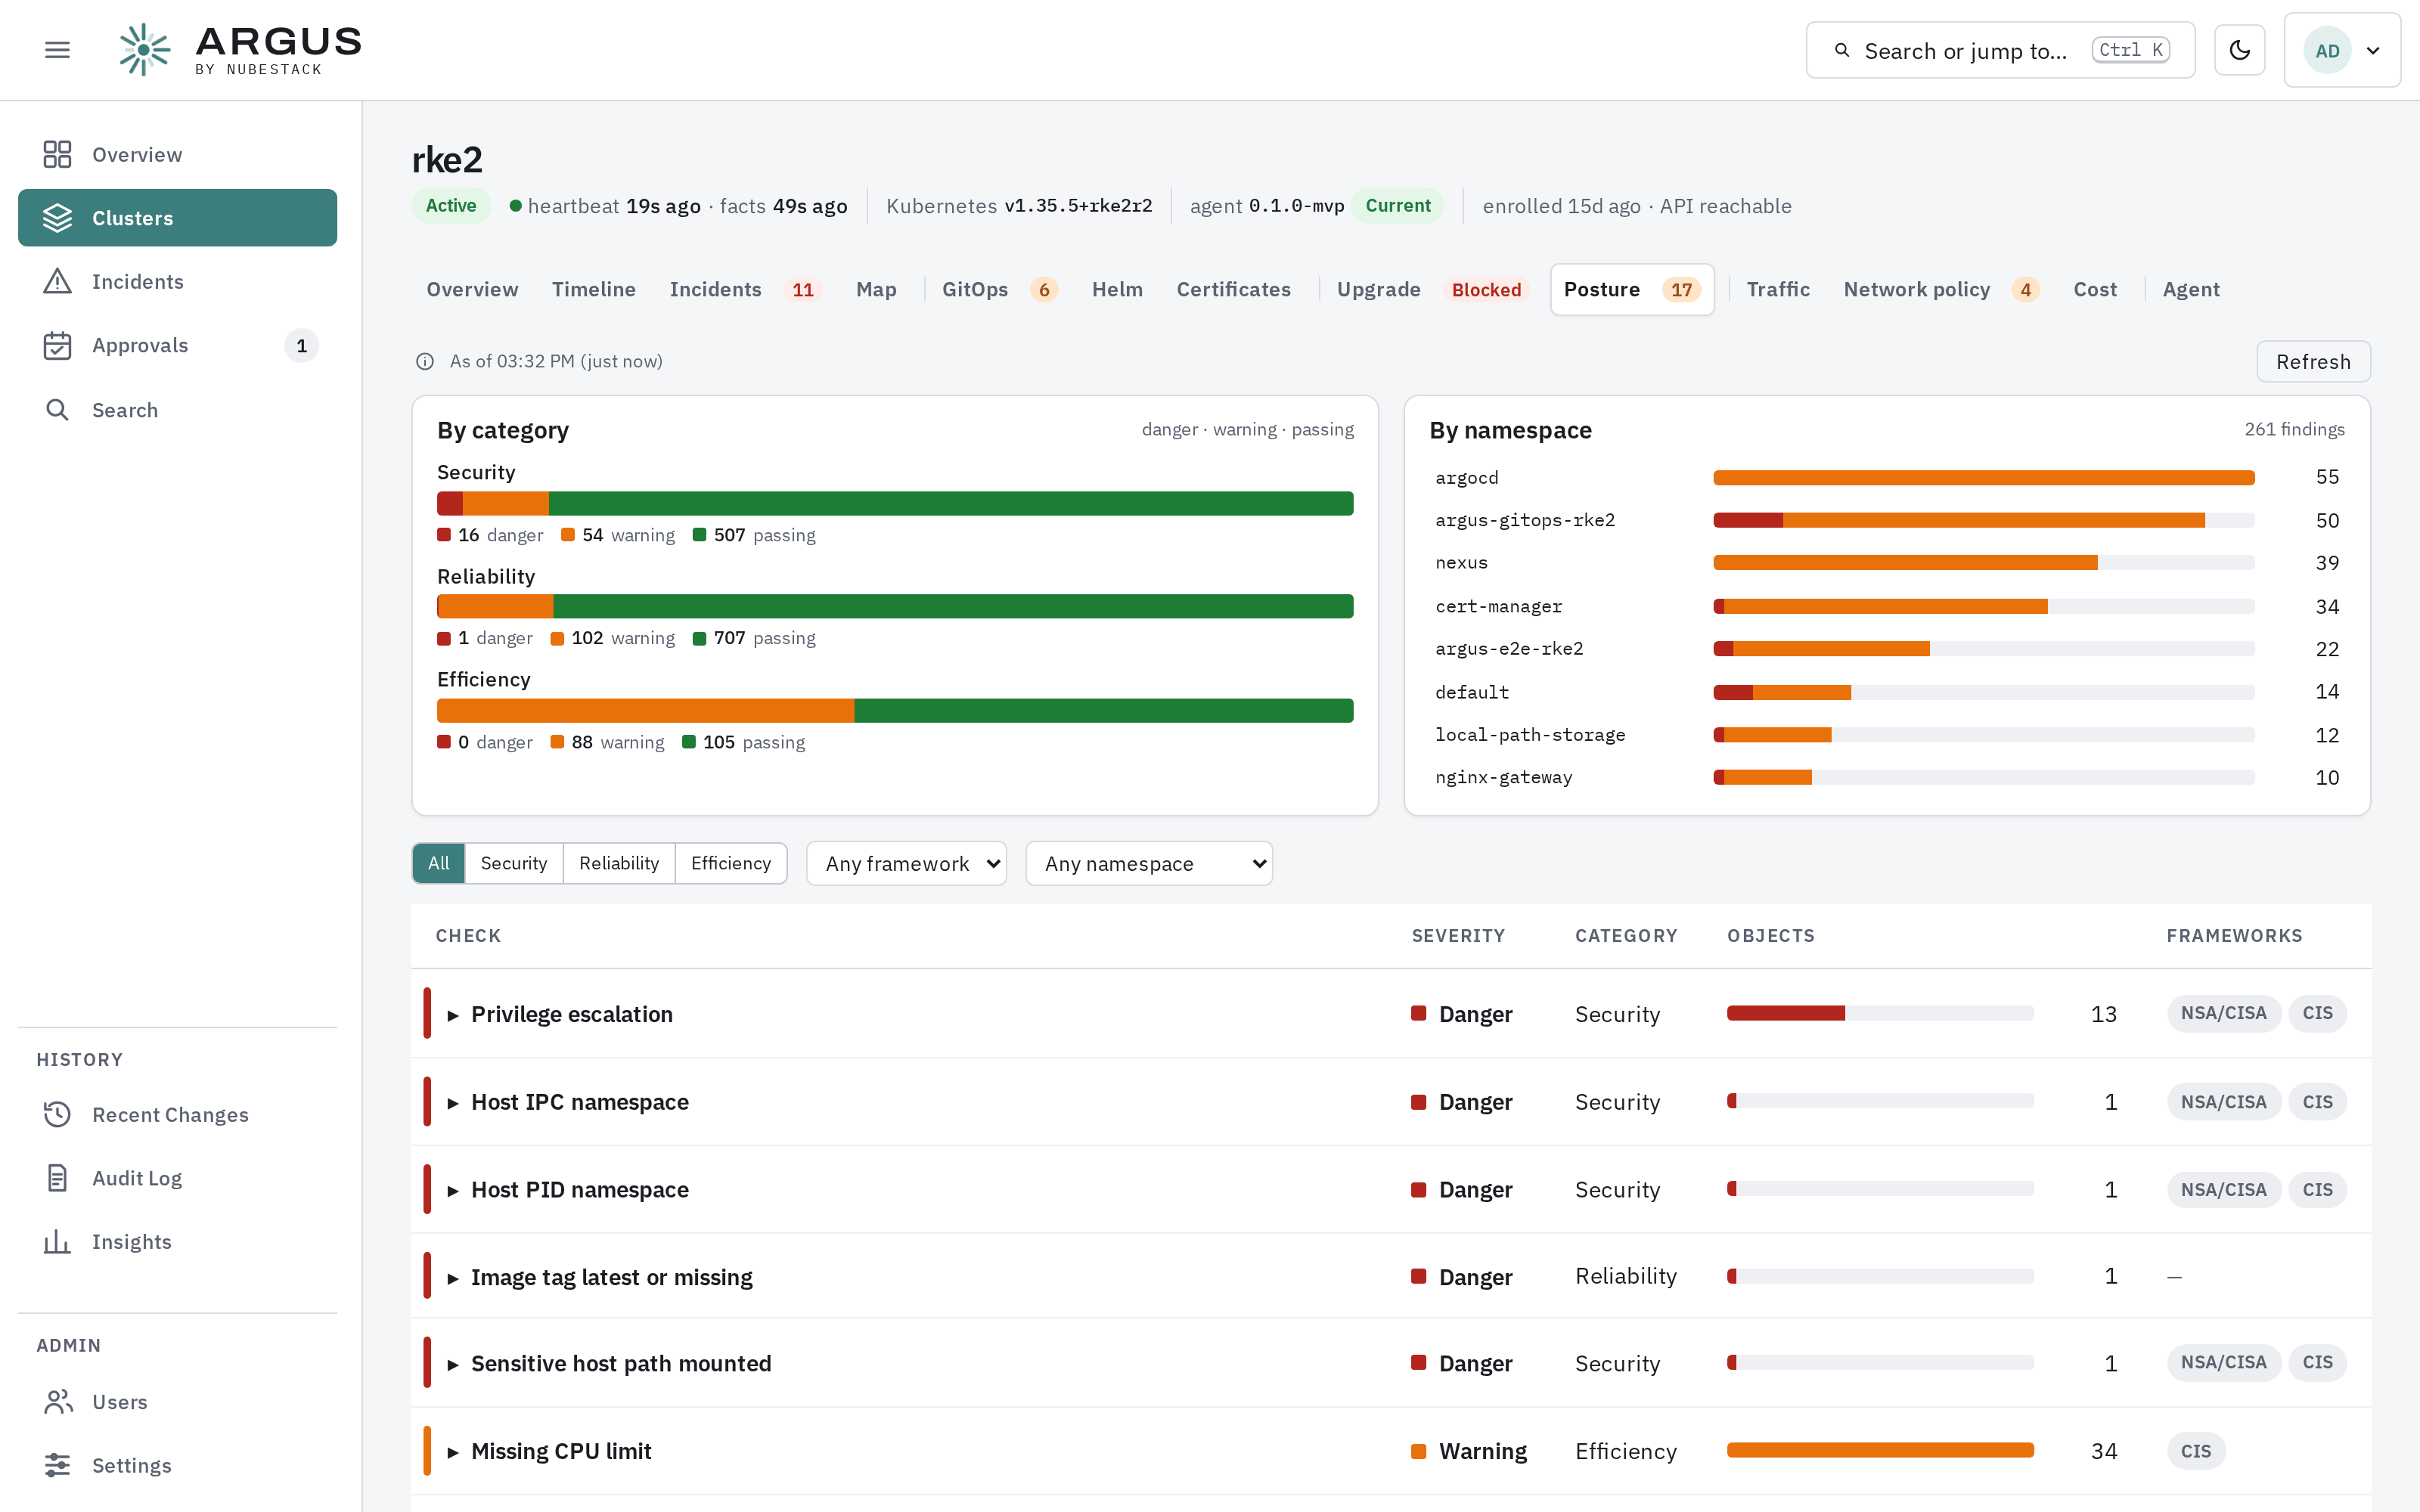
Where the cluster is weakest, by category and by namespace, then one row per check.
Posture checks find settings that carry risk before anything breaks: privilege escalation,
host namespaces, missing resource limits, images tagged latest, and many more. They are
grouped into security, reliability and efficiency, each counted as danger, warning or
passing.
Each check row gives its severity, category, how many objects it fired on and the frameworks that name it, such as NSA/CISA and CIS. Expand a row for why it matters, the fix, and the objects, each of which opens in the object panel.
Posture findings are risks. They never open incidents; they appear here and as signals.
Exceptions
A team can set a check aside where it keeps its manifests: annotate the object, or its
namespace, with argus.io/ignore-checks and a comma-separated list of check IDs, or * for
every check.
An excepted finding is not dropped. It is listed at the bottom of the tab under set aside by argus.io/ignore-checks, counted nowhere else, and never sent as a signal. Remove the annotation and the finding returns on the next read. The same annotation on a declarative rule's object suppresses that rule's risk findings, never a fault.
For exceptions that apply to every cluster, use Settings → Detectors → Posture: checks turned off and namespaces left out for the whole organisation, on top of what each agent's own configuration already excludes.
Cost
Cost shows hourly spend per namespace from OpenCost's metrics in your cluster's Prometheus. The currency is whatever OpenCost is configured with and is never converted. Without OpenCost, or without the agent's Prometheus connection, the tab says which and shows no figures.
Rightsizing
Below the spend, Rightsizing compares each container's CPU and memory requests with what it used over the last seven days, for the namespace you pick. It needs the agent's Prometheus connection, not OpenCost.
| Column | Meaning |
|---|---|
| p95 | The 95th percentile of usage, from the busiest replica |
| Peak | The highest memory working set in the window |
| Recommend | p95 plus 20%, and for memory never below the peak |
| Under | p95 is above the request: the container runs on burst |
| Over | The request is at least twice the recommendation, and the gap is material |
| Near limit | Peak memory reached 90% of the memory limit |
A pod sized with pod-level resources is shown at pod level, with no per-container recommendation. Nothing here changes anything: an investigation can use these figures when it proposes a resource-limits change, which goes through approval like any other.