Map, network policy and traffic
Three tabs on the cluster page describe how workloads connect: the Map draws the paths traffic takes, Network policy says what is allowed to talk to what, and Traffic shows what actually does.
Map
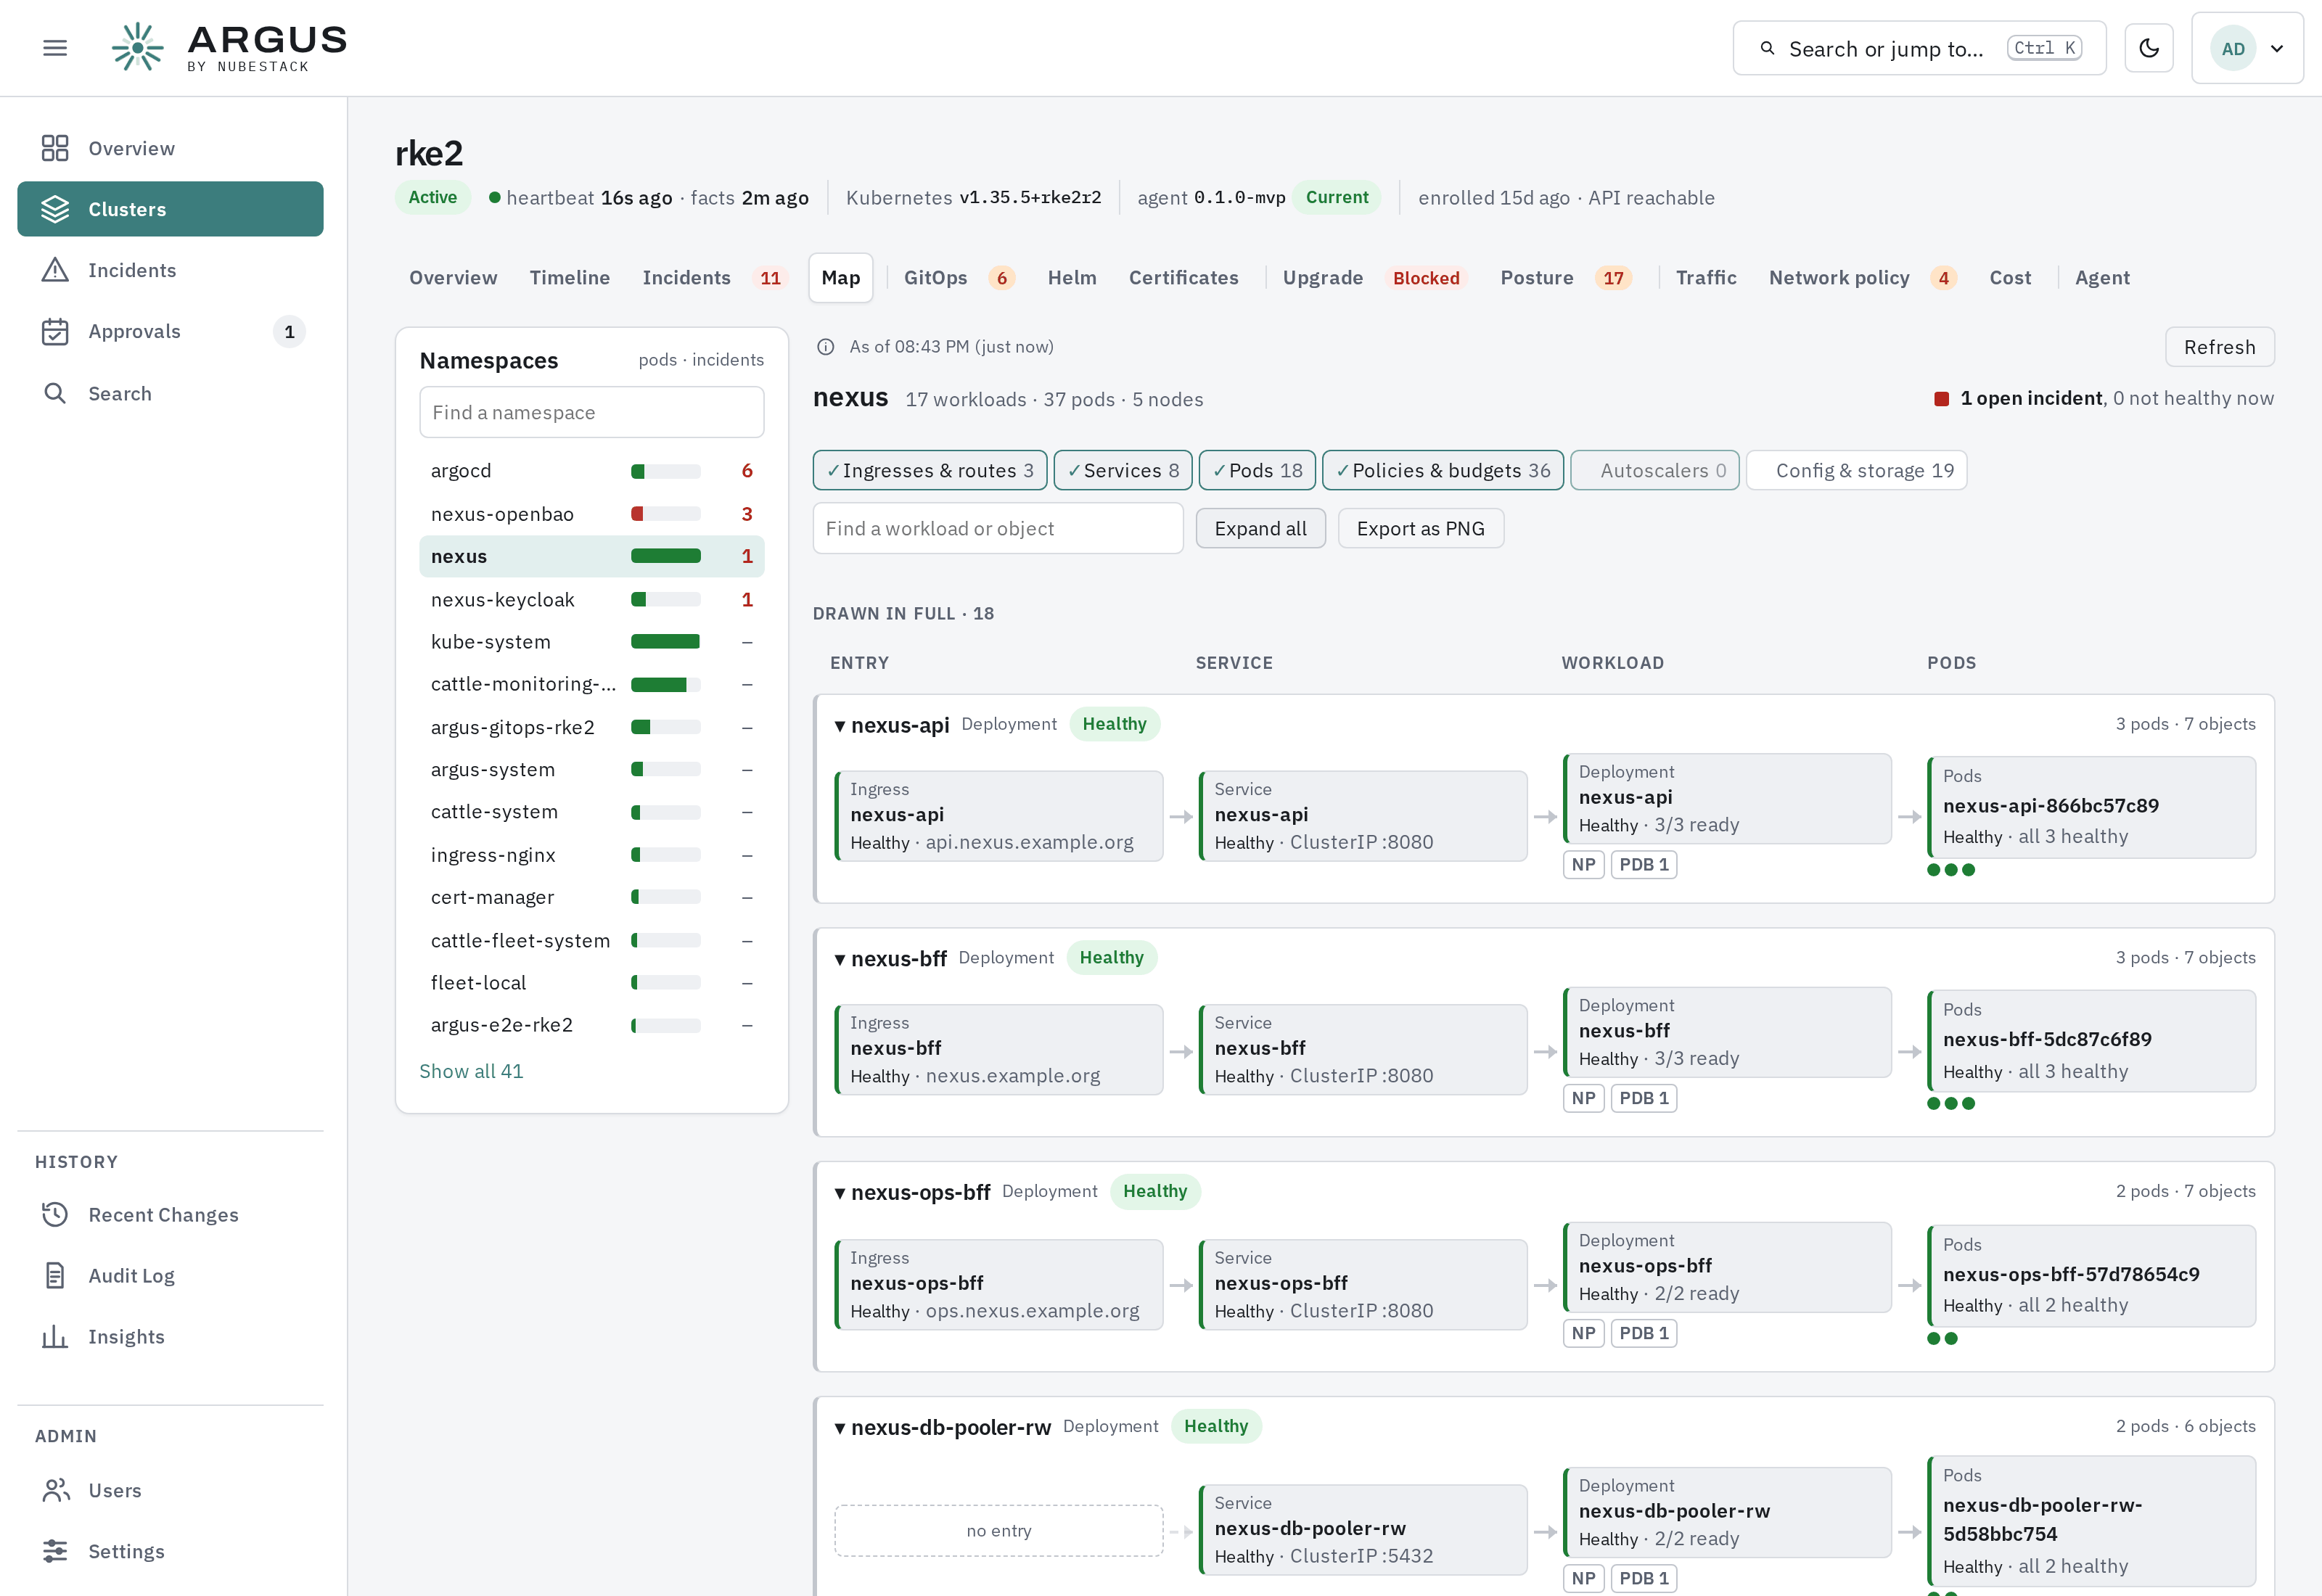
Each chain is the path traffic takes: ingress, service, workload, pods. Every link carries its own health, and the NP and PDB marks say a network policy and a disruption budget cover the workload.
Choose a namespace from the rail on the left; each namespace shows how many pods it holds and how many open incidents. For the chosen namespace, each workload is drawn as a chain:
Each node carries its health, and a broken link — a service with no ready endpoints, an ingress with no backend — shows where the chain fails. Workloads that need attention come first, with their open incident linked; healthy ones collapse to a single line.
The chips above the map count ingresses and routes, services, pods, policies and budgets, autoscalers, and configuration and storage, and filter the map to them. Find narrows to one workload or object, Expand all opens every chain, and Export as PNG saves the picture. Select any object to open it in the object panel.
Network policy
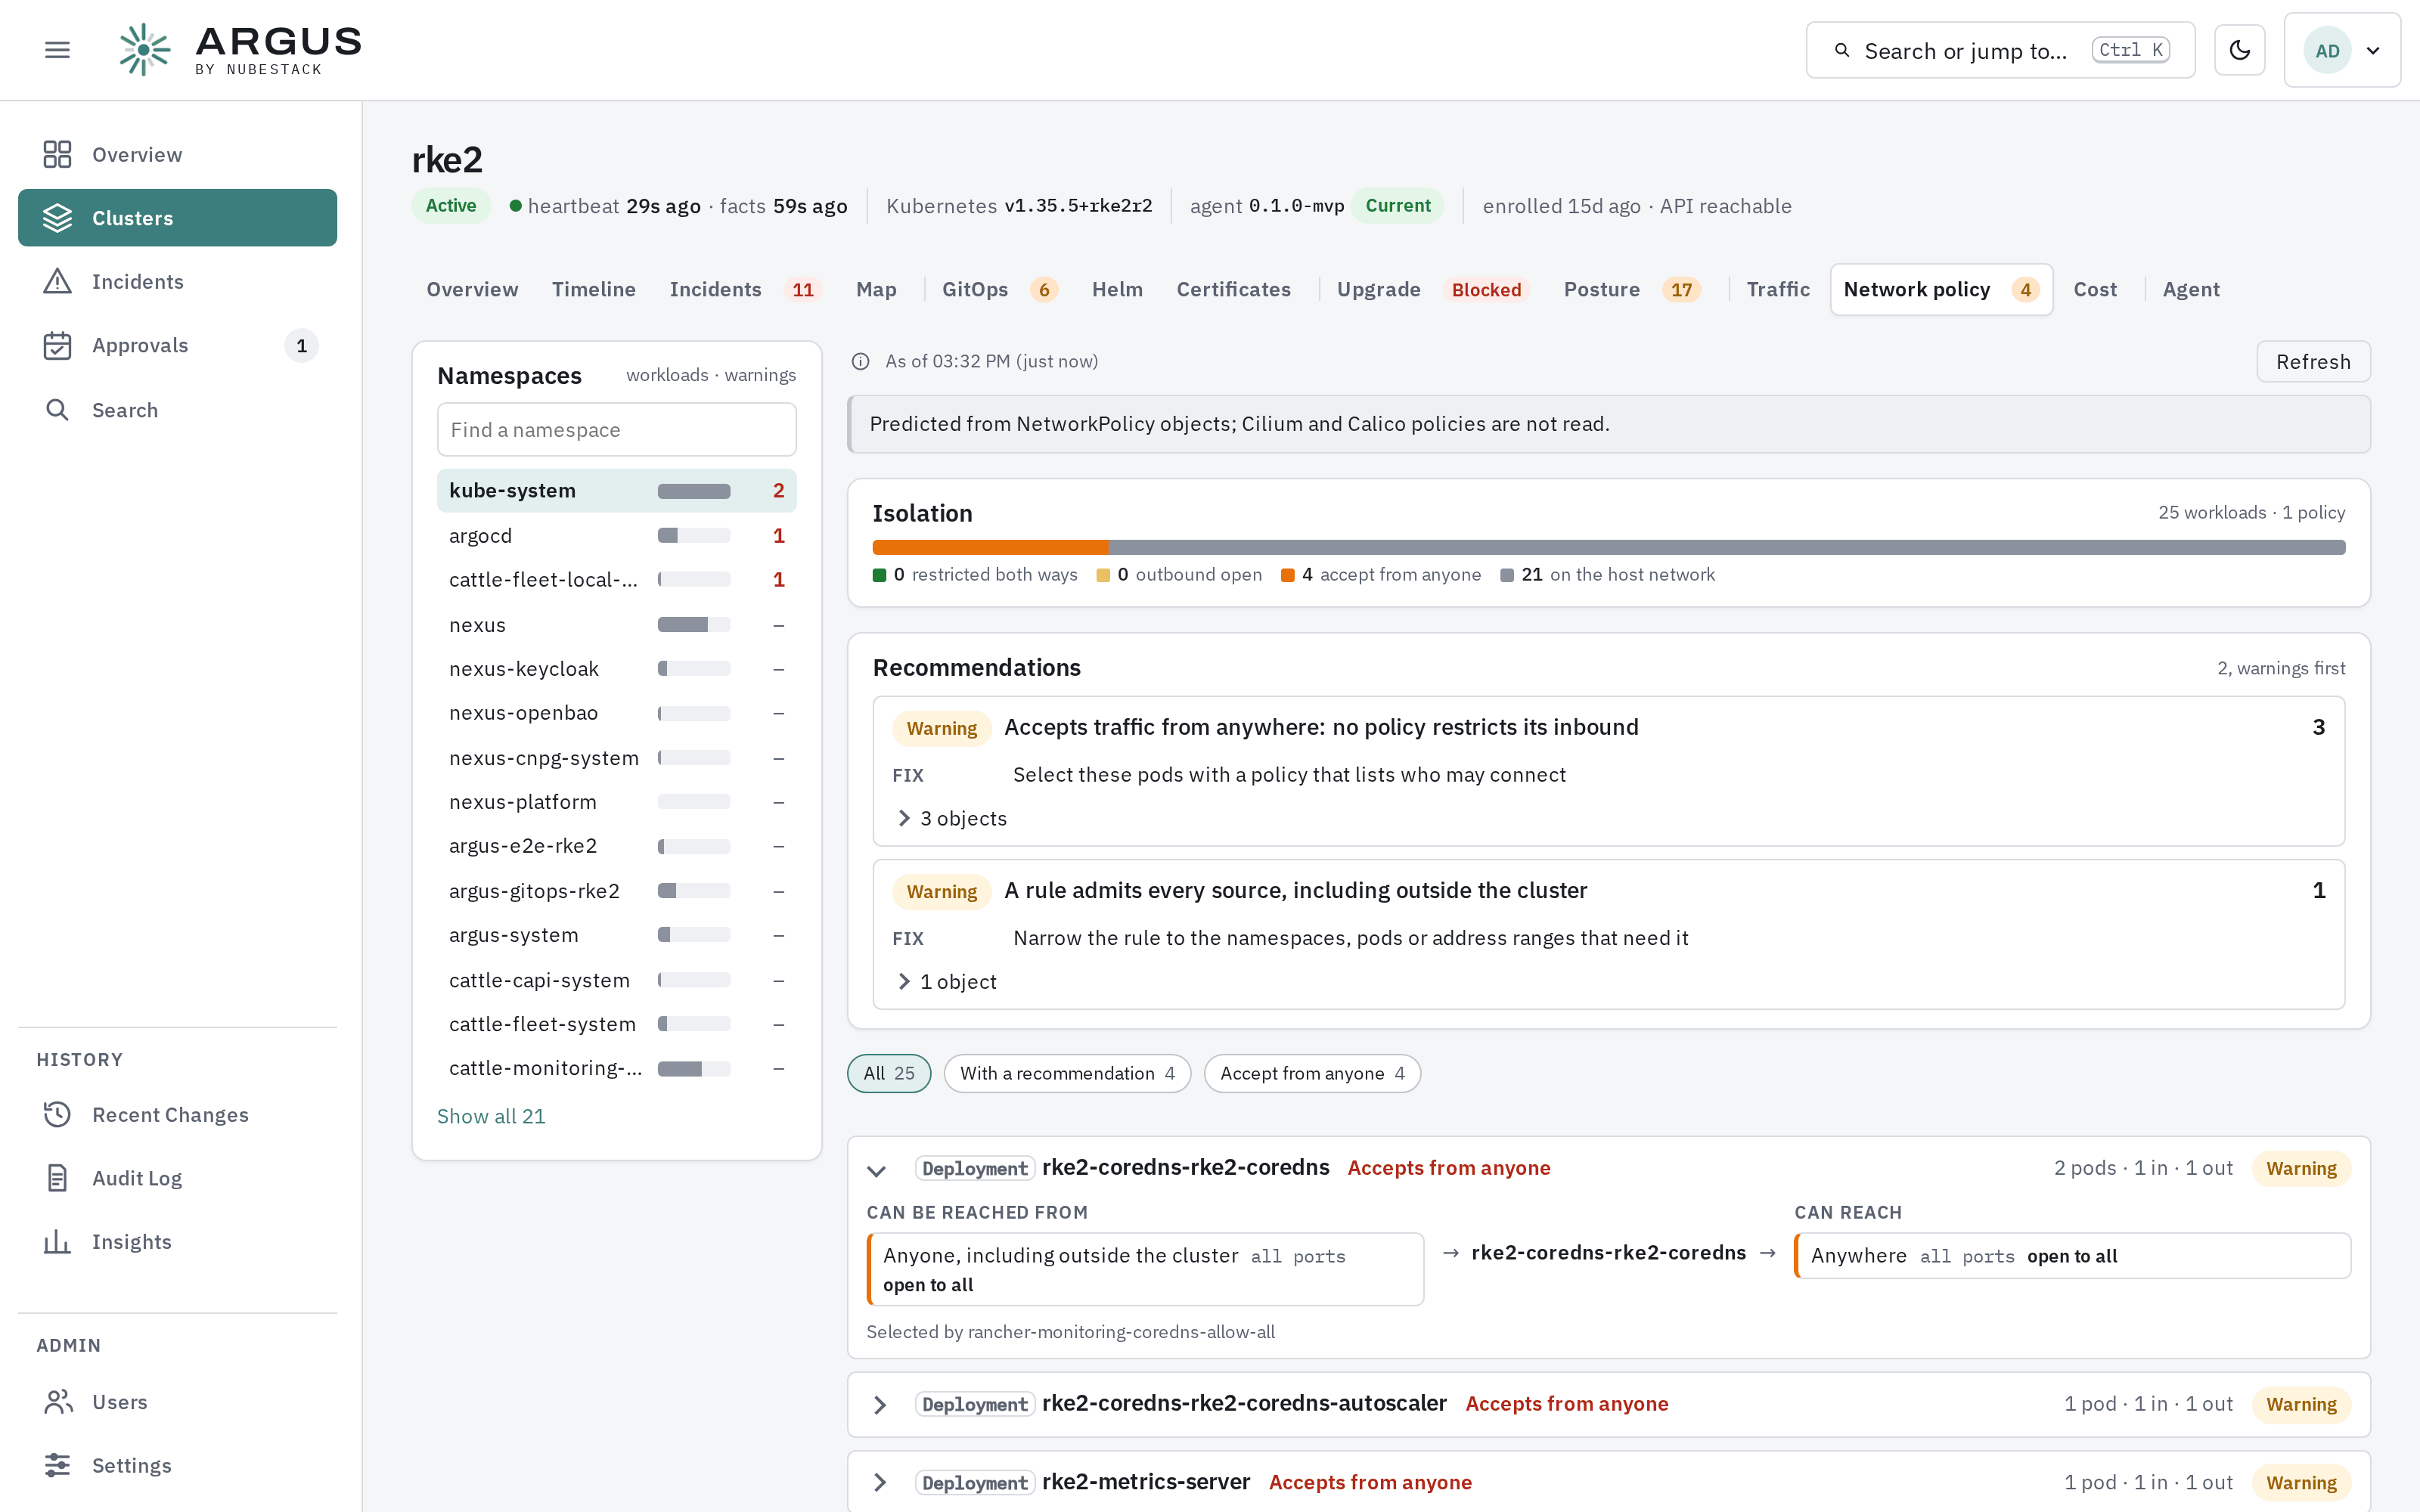
Isolation first, then what to change, then each workload's allowed sources and destinations.
The tab reads the cluster's NetworkPolicy objects and predicts what each workload may receive from and send to. It is a prediction from the policies: the network plugin enforces them, and Cilium and Calico policies of their own kinds are not read.
For the chosen namespace:
| Section | Shows |
|---|---|
| Isolation | How many workloads are restricted both ways, open outbound, accept from anyone, or run on the host network |
| Recommendations | Each problem, how many workloads it affects, and the fix |
| Against observed traffic | With a traffic source: traffic no rule allows, and rules that saw no traffic in the last 15 minutes |
| Workloads | For each workload, who can reach it and what it can reach, and which policy decides |
The namespace rail counts workloads and warnings per namespace, so the least protected namespaces stand out.
Against observed traffic compares the policies with what the traffic source saw. Traffic that no rule allows means the network plugin is not enforcing the policies, or ARGUS read them wrongly. A rule with no matching traffic is grouped under its workload: a hint for tightening, not proof the rule is unused, since the window is 15 minutes. Traffic whose direction is not known (mostly DNS) and traffic from a node are not judged: Kubernetes always lets a pod and its own node talk, and a flow does not say which node the pod is on.
Traffic
Traffic draws which workloads talk to which, from metrics a traffic source exports to Prometheus: Istio's request and connection metrics, Grafana Beyla's network flow and HTTP metrics, or Cilium Hubble's flow metrics. A plain Prometheus has none of these, so the tab needs one of them installed as well as the agent's Prometheus connection (see Connect a cluster). Without one, the tab says which metrics it looked for.
The graph draws every workload that sent or received traffic in the window (5 minutes, 15 minutes or an hour), grouped by namespace, with a link for each flow. Each link carries its rate, and its 5xx share where requests are measured; a link with errors is also dashed. The canvas grows with the graph, and a very wide graph scrolls sideways instead of shrinking below reading size. Choose a namespace to narrow the graph, and Busiest first or Errors first to order the table under it, which lists every flow and can be sorted by any column. A Service and the workload behind it are one node, so a connection is counted once.