The overview
Overview is the fleet on one page, arranged by when things have consequences: what is open now, what comes due in the next ninety days, and how each cluster stands.
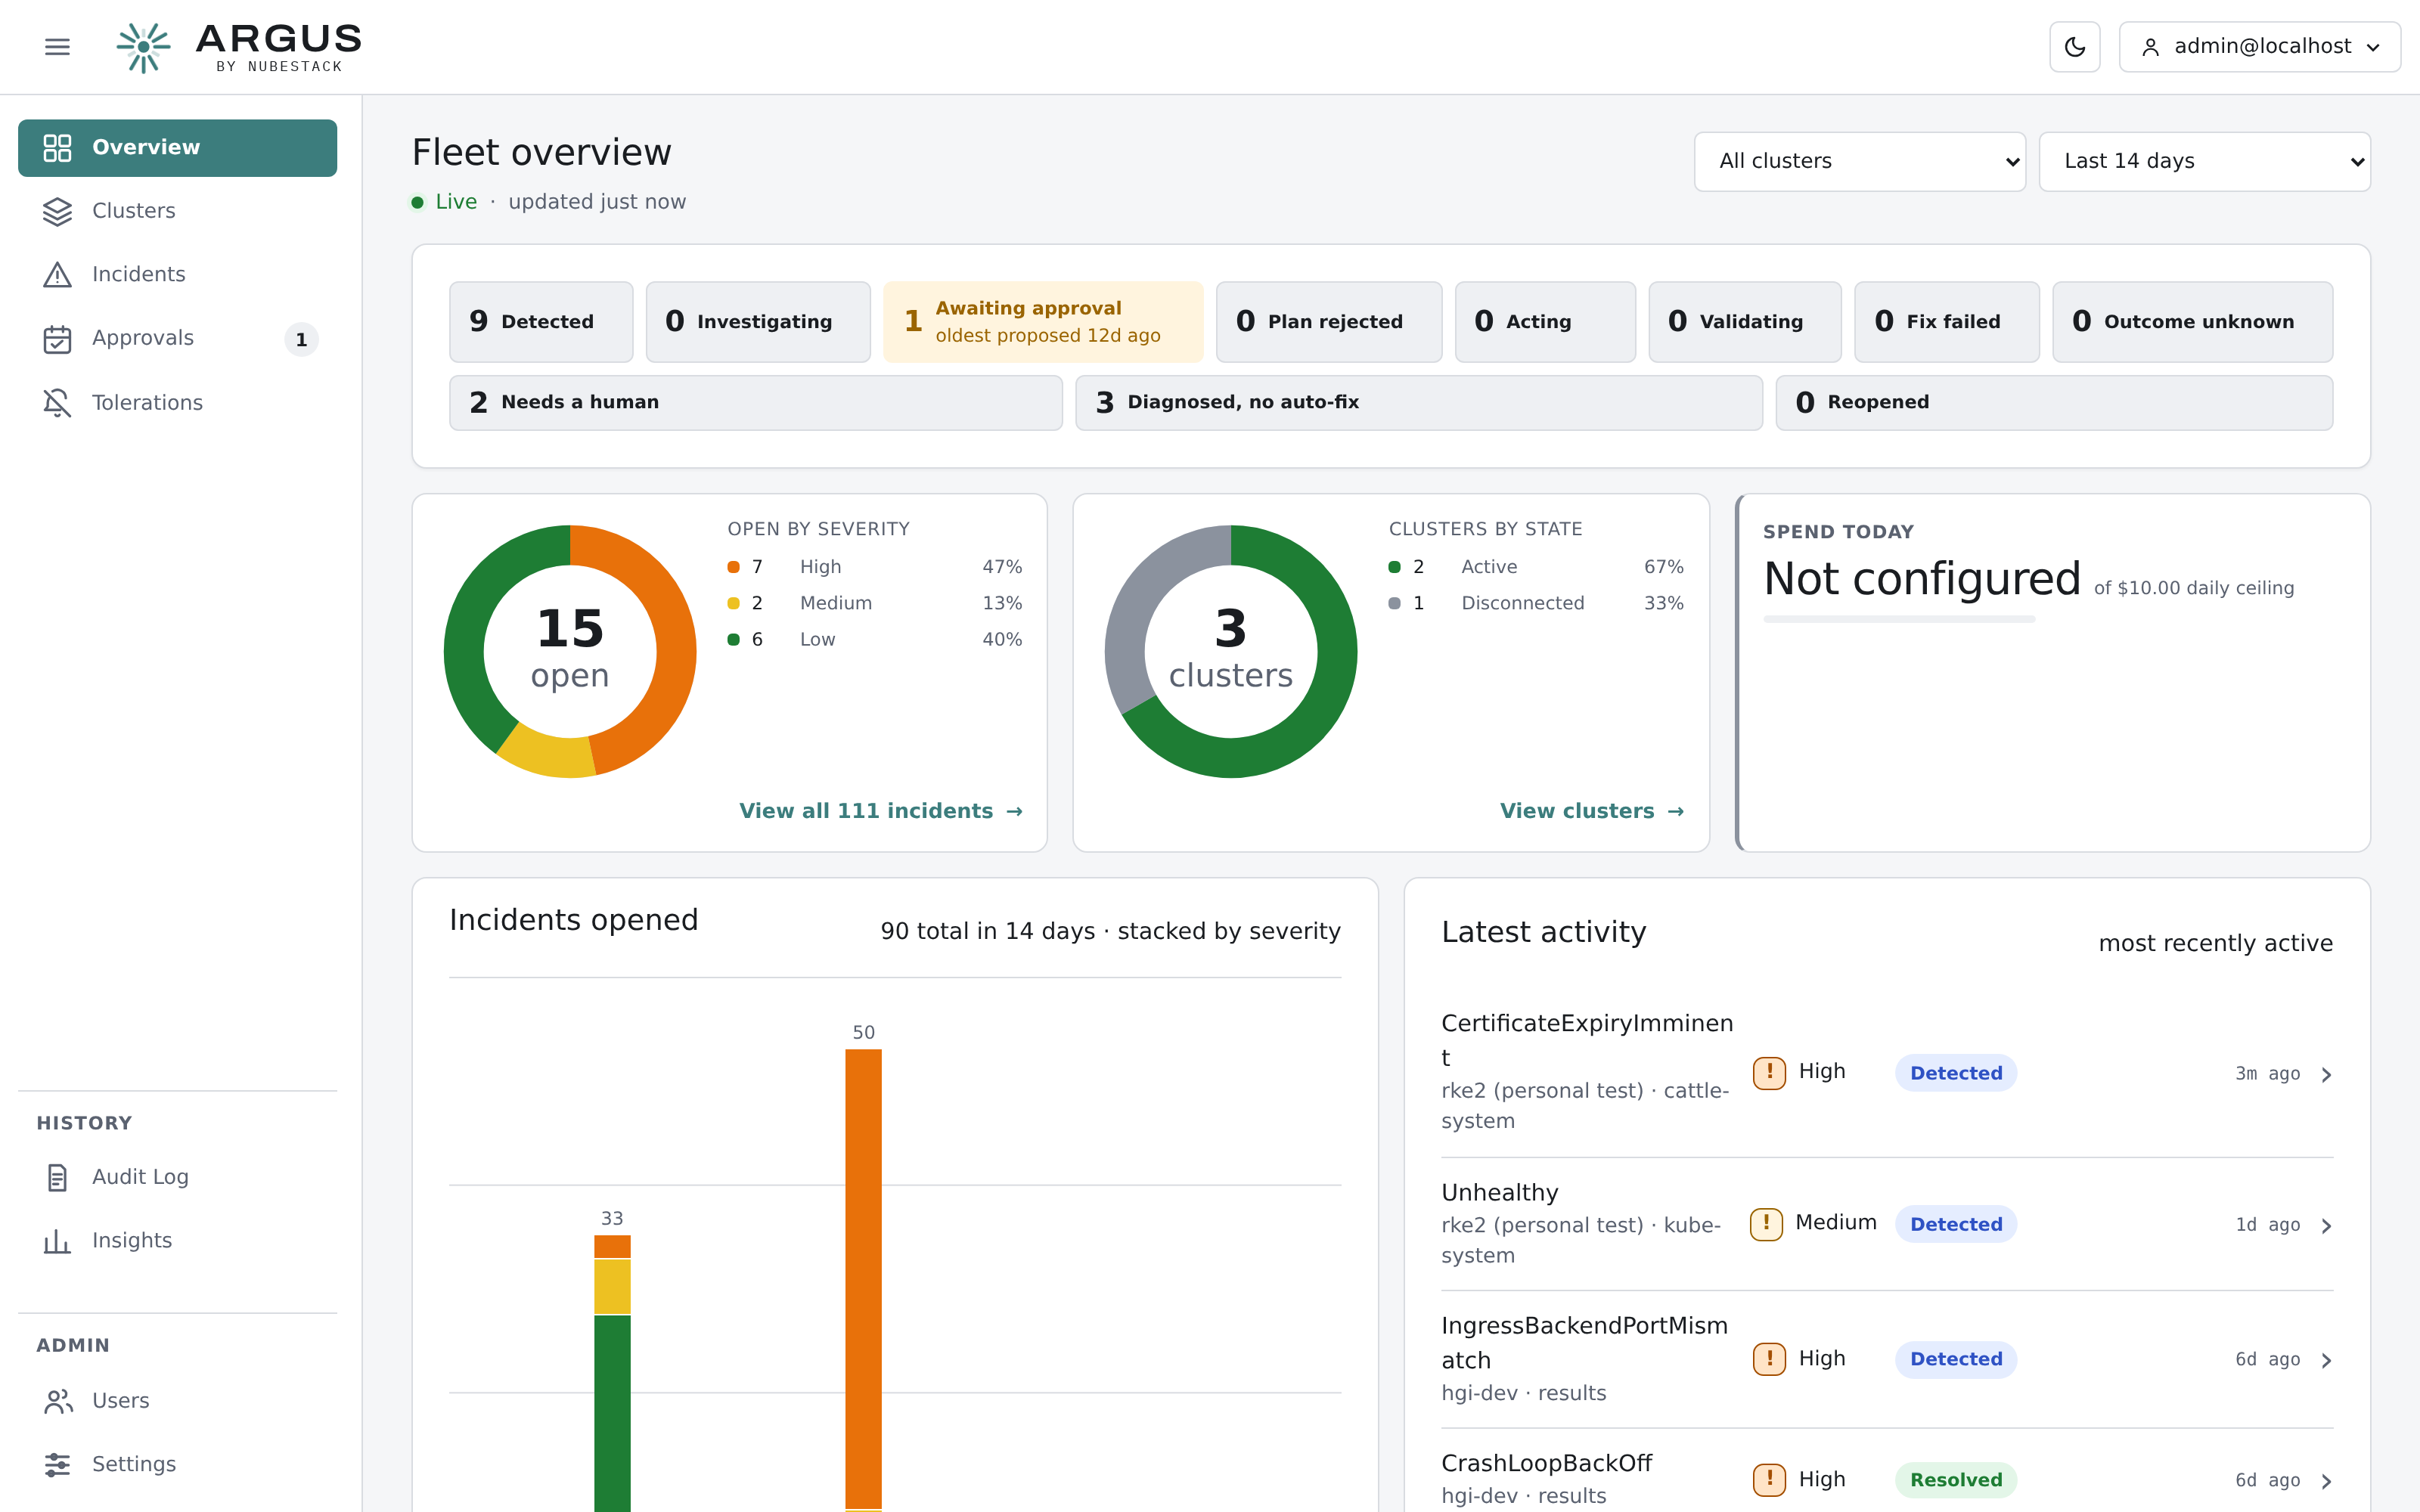
Four tiles, then three bands. Every figure is a whole-fleet count from the hub, never a count of whatever happened to load.
Tiles
| Tile | Shows |
|---|---|
| Open incidents | How many incidents are open, the trend over 14 or 30 days, and how they split across the lifecycle |
| Your move | Incidents waiting on a person, each drawn against the 48-hour and five-day marks, with the oldest wait |
| Nodes ready | Every node in the fleet as one hexagon, coloured by readiness |
| Fleet capacity | CPU and memory in use against what is allocatable, for the clusters that measure it |
Choose a cluster at the top right to narrow the page to it, and 14 d or 30 d for the trend window.
Now
Waiting on a person lists the incidents where nothing happens until someone acts, most urgent first, each with its state and how long it has waited. Clusters draws one ring per cluster, split by severity of its open incidents. Incidents opened charts new incidents per day by severity.
Next 90 days
Coming due puts certificate expiries and the opening of maintenance and freeze windows on one time axis, so you can see what lands when.
Standing
How each cluster stands on the things that change slowly: the upgrade ladder against the next Kubernetes version, posture findings by cluster, capacity, and the health of Helm releases and GitOps applications, with each cluster's agent state. A final line summarises automation and model spend.
Each card is refreshed by the hub in the background, says how old its figures are, and draws the worst clusters first with the rest summed.
When the same application runs different versions on different clusters, Delivery &
agents adds one line saying how many; open it for each application and the version on each
cluster, linked to that cluster's GitOps or Helm tab. An application is an Argo CD
Application or Flux object deploying the same repository and path (or carrying the same
argus.io/app annotation) on several clusters. Plain Helm releases are not compared: the
agent sees only a release's revision number, which counts per cluster, not its chart
version. Failing releases and applications already show as red squares in the same card,
and open incidents.