The cluster page
Open a cluster from Clusters or the overview for everything ARGUS knows about it, one tab per question.
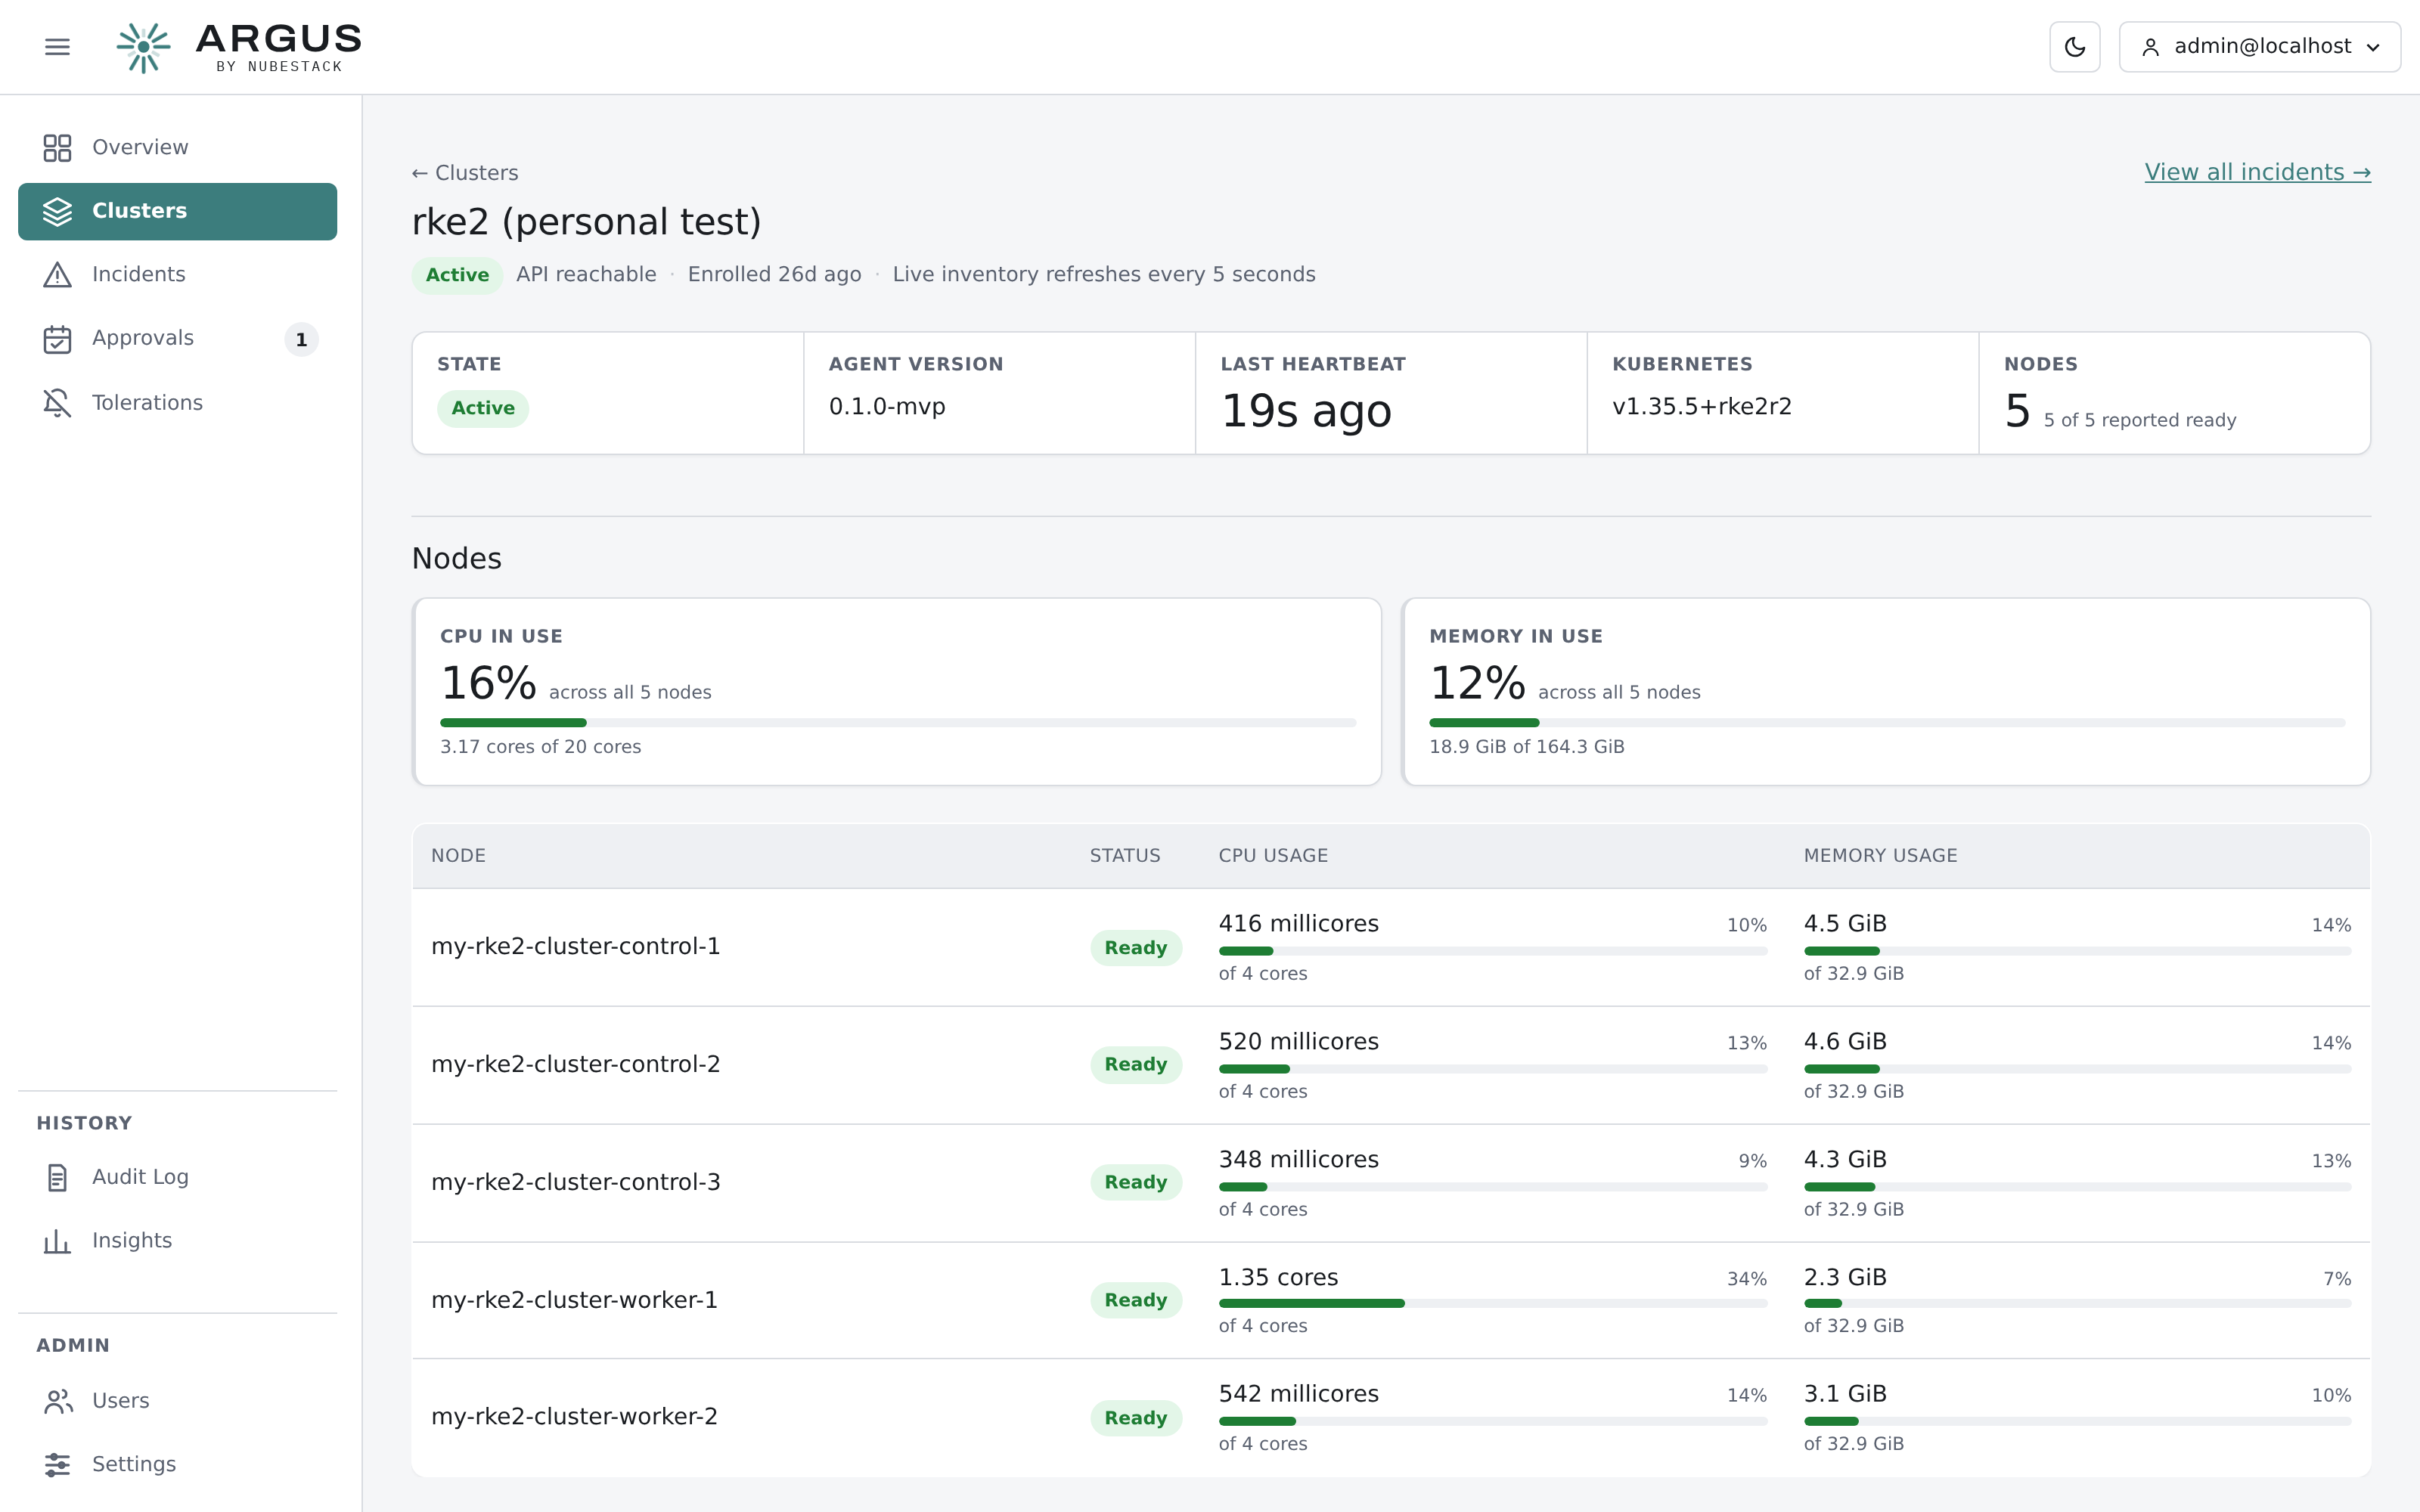
The header carries the cluster's state, last heartbeat, Kubernetes and agent versions. Tabs with something to look at carry a count.
The header
The header shows the cluster's state, when the agent last reported and when it last sent its facts, the Kubernetes version, the agent version and whether it is compatible with this hub, and when the cluster was enrolled.
Tabs
| Tab | Answers |
|---|---|
| Overview | Is this cluster healthy, and what needs attention |
| Timeline | What happened here, and when |
| Incidents | Which of this cluster's incidents need someone |
| Map | How workloads connect: entry, service, workload, pods |
| GitOps | What Argo CD and Flux report about their applications |
| Helm | Which releases are deployed and how healthy their objects are |
| Certificates | What expires next |
| Upgrade | What would break on the next Kubernetes version |
| Posture | Which settings carry security, reliability or efficiency risk |
| Traffic | Which workloads talk to which, from a traffic source in Prometheus |
| Network policy | What may talk to what, and where policy is missing or too open |
| Cost | Spend per namespace and its trend, from OpenCost or Kubecost, and rightsizing per container |
| Agent | What the agent watches, how detection is running, and what it may change |
The selected tab is part of the address, so a link opens the same view.
Overview
Rings for pods, workloads and nodes, each split into words — running, completed, failed, ready, not ready — and Resource use: CPU and memory used and requested against what is allocatable. Objects by kind counts what is in the cluster. Needs attention lists open incidents and problems by severity, and Changes charts recent changes per five minutes, with the busiest objects listed. On a cluster running Karpenter, Karpenter capacity shows each NodePool's limits against what its nodes use, and any NodeClaims not yet ready.
Timeline
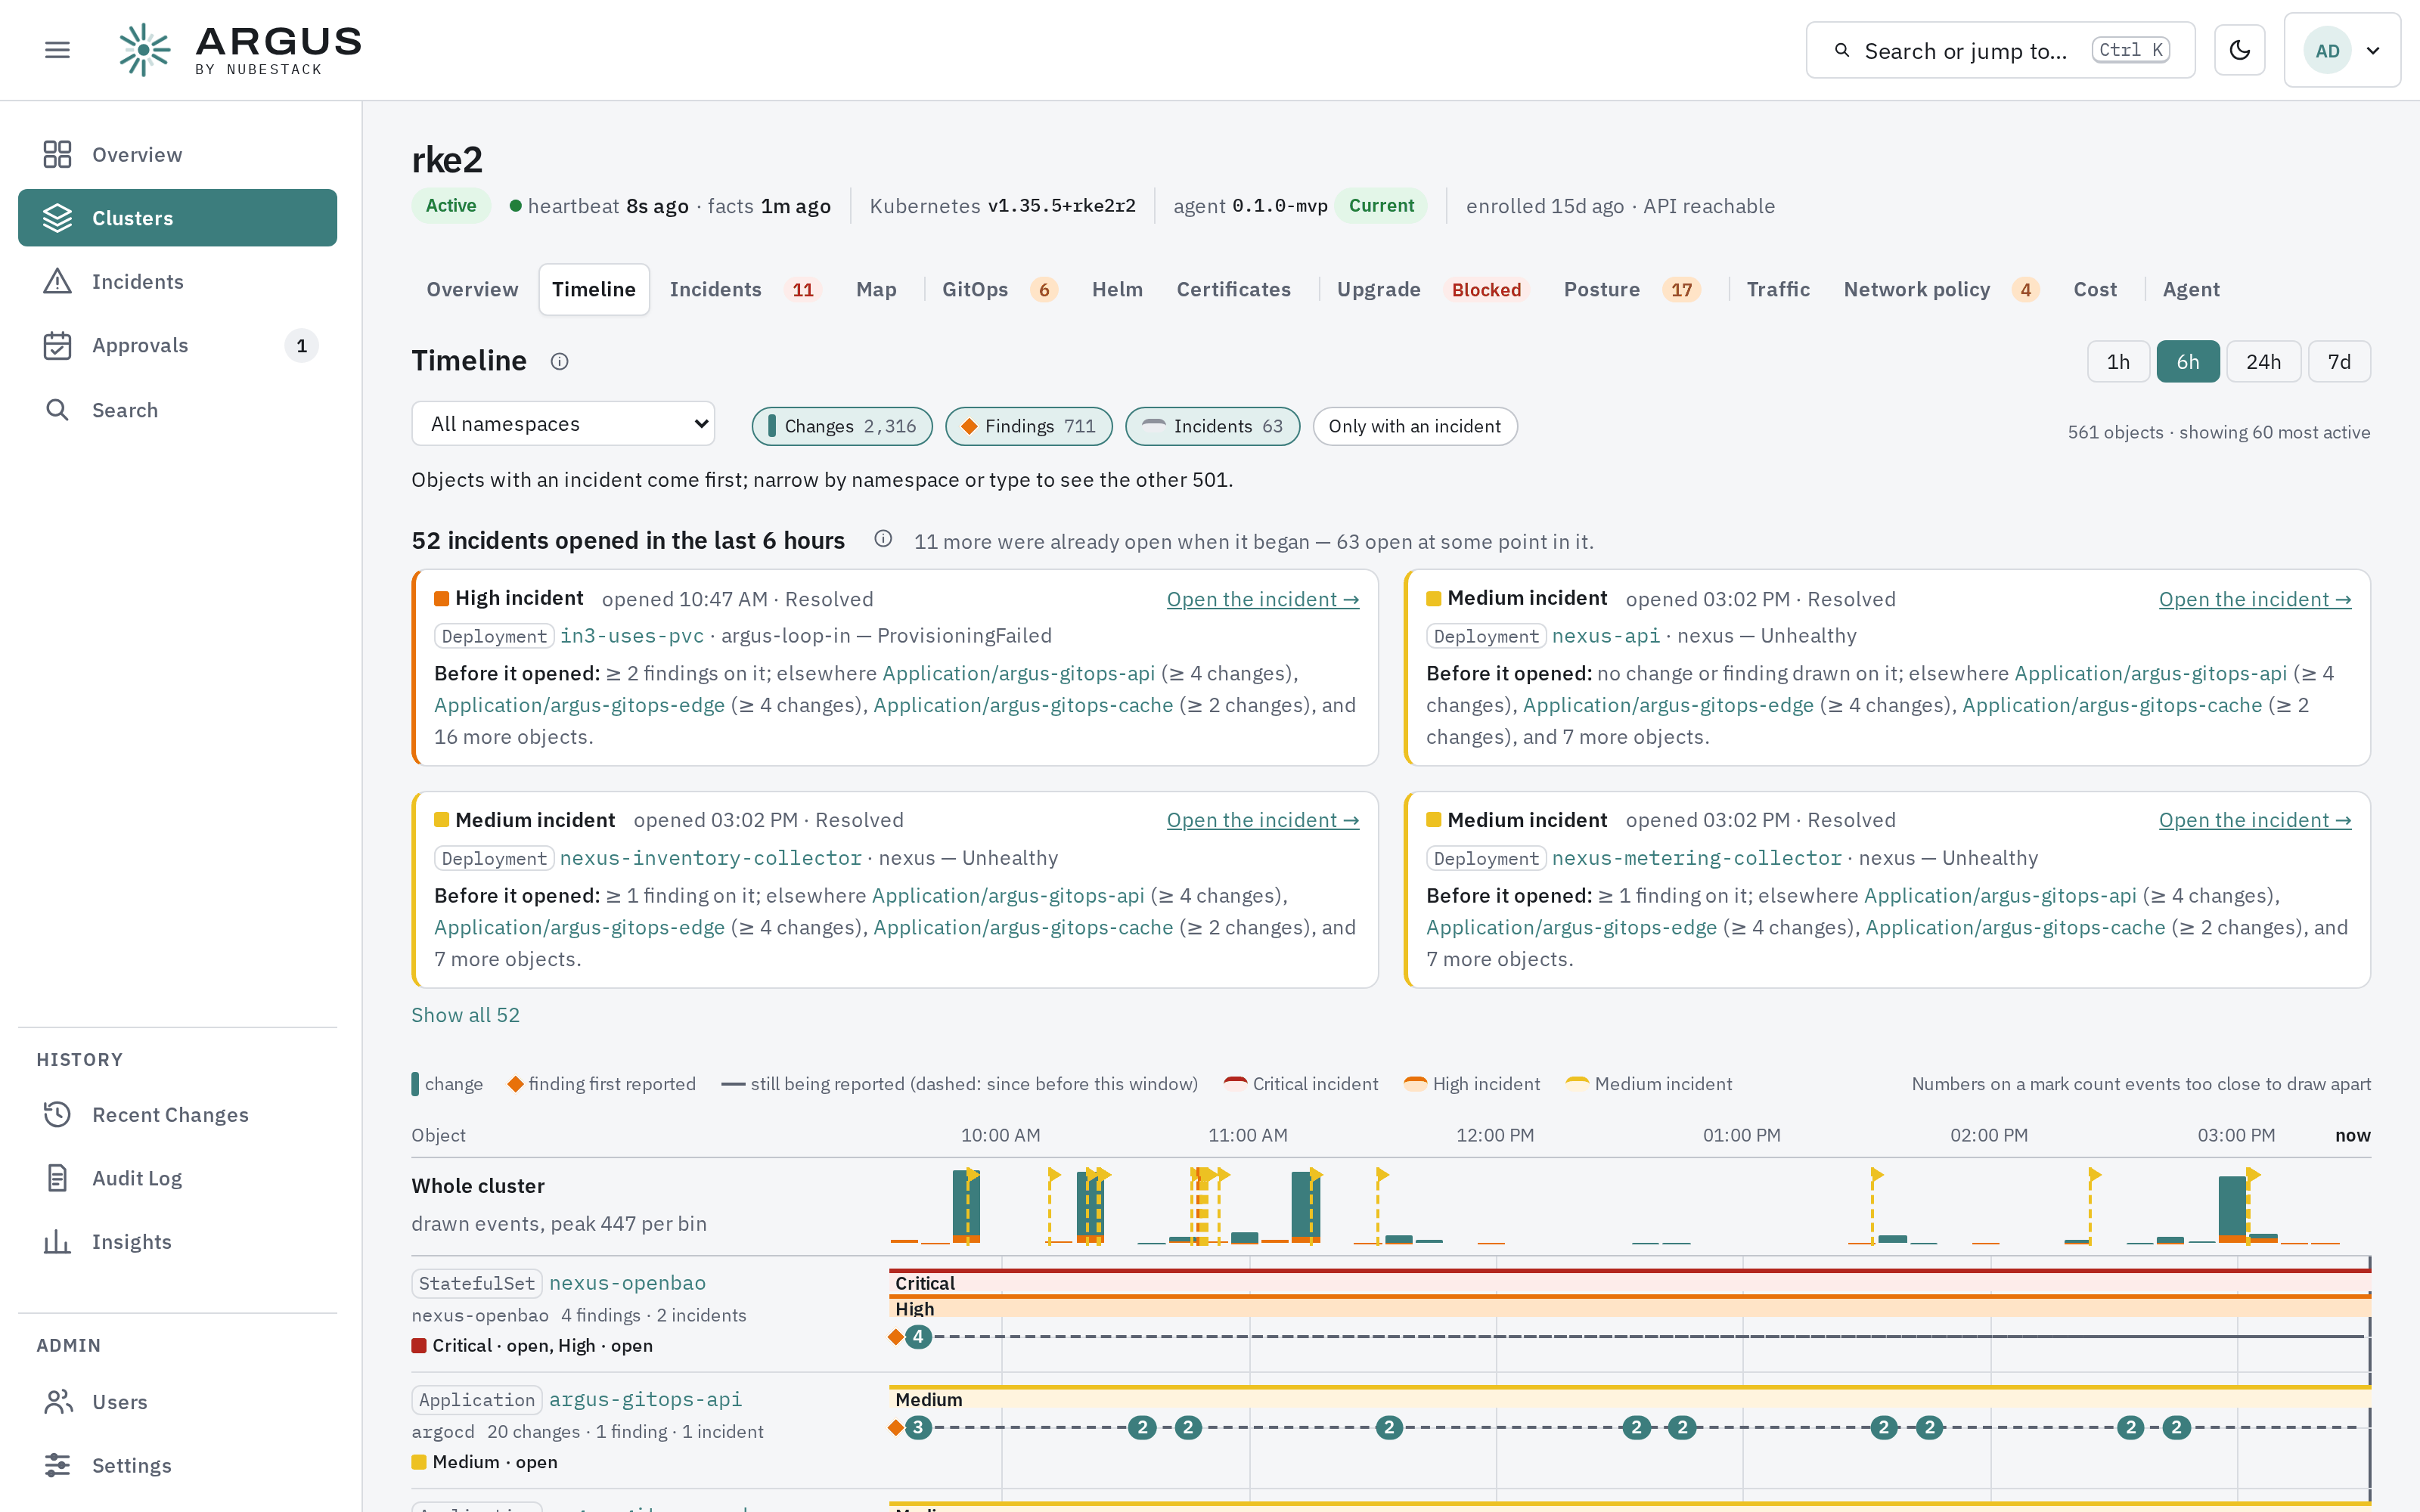
Each incident shows what changed before it opened. Below, one row per object marks its changes, its findings and its incidents on one time axis.
Choose a window — one hour to seven days — and narrow by namespace or type. Objects with an incident come first.
Incidents
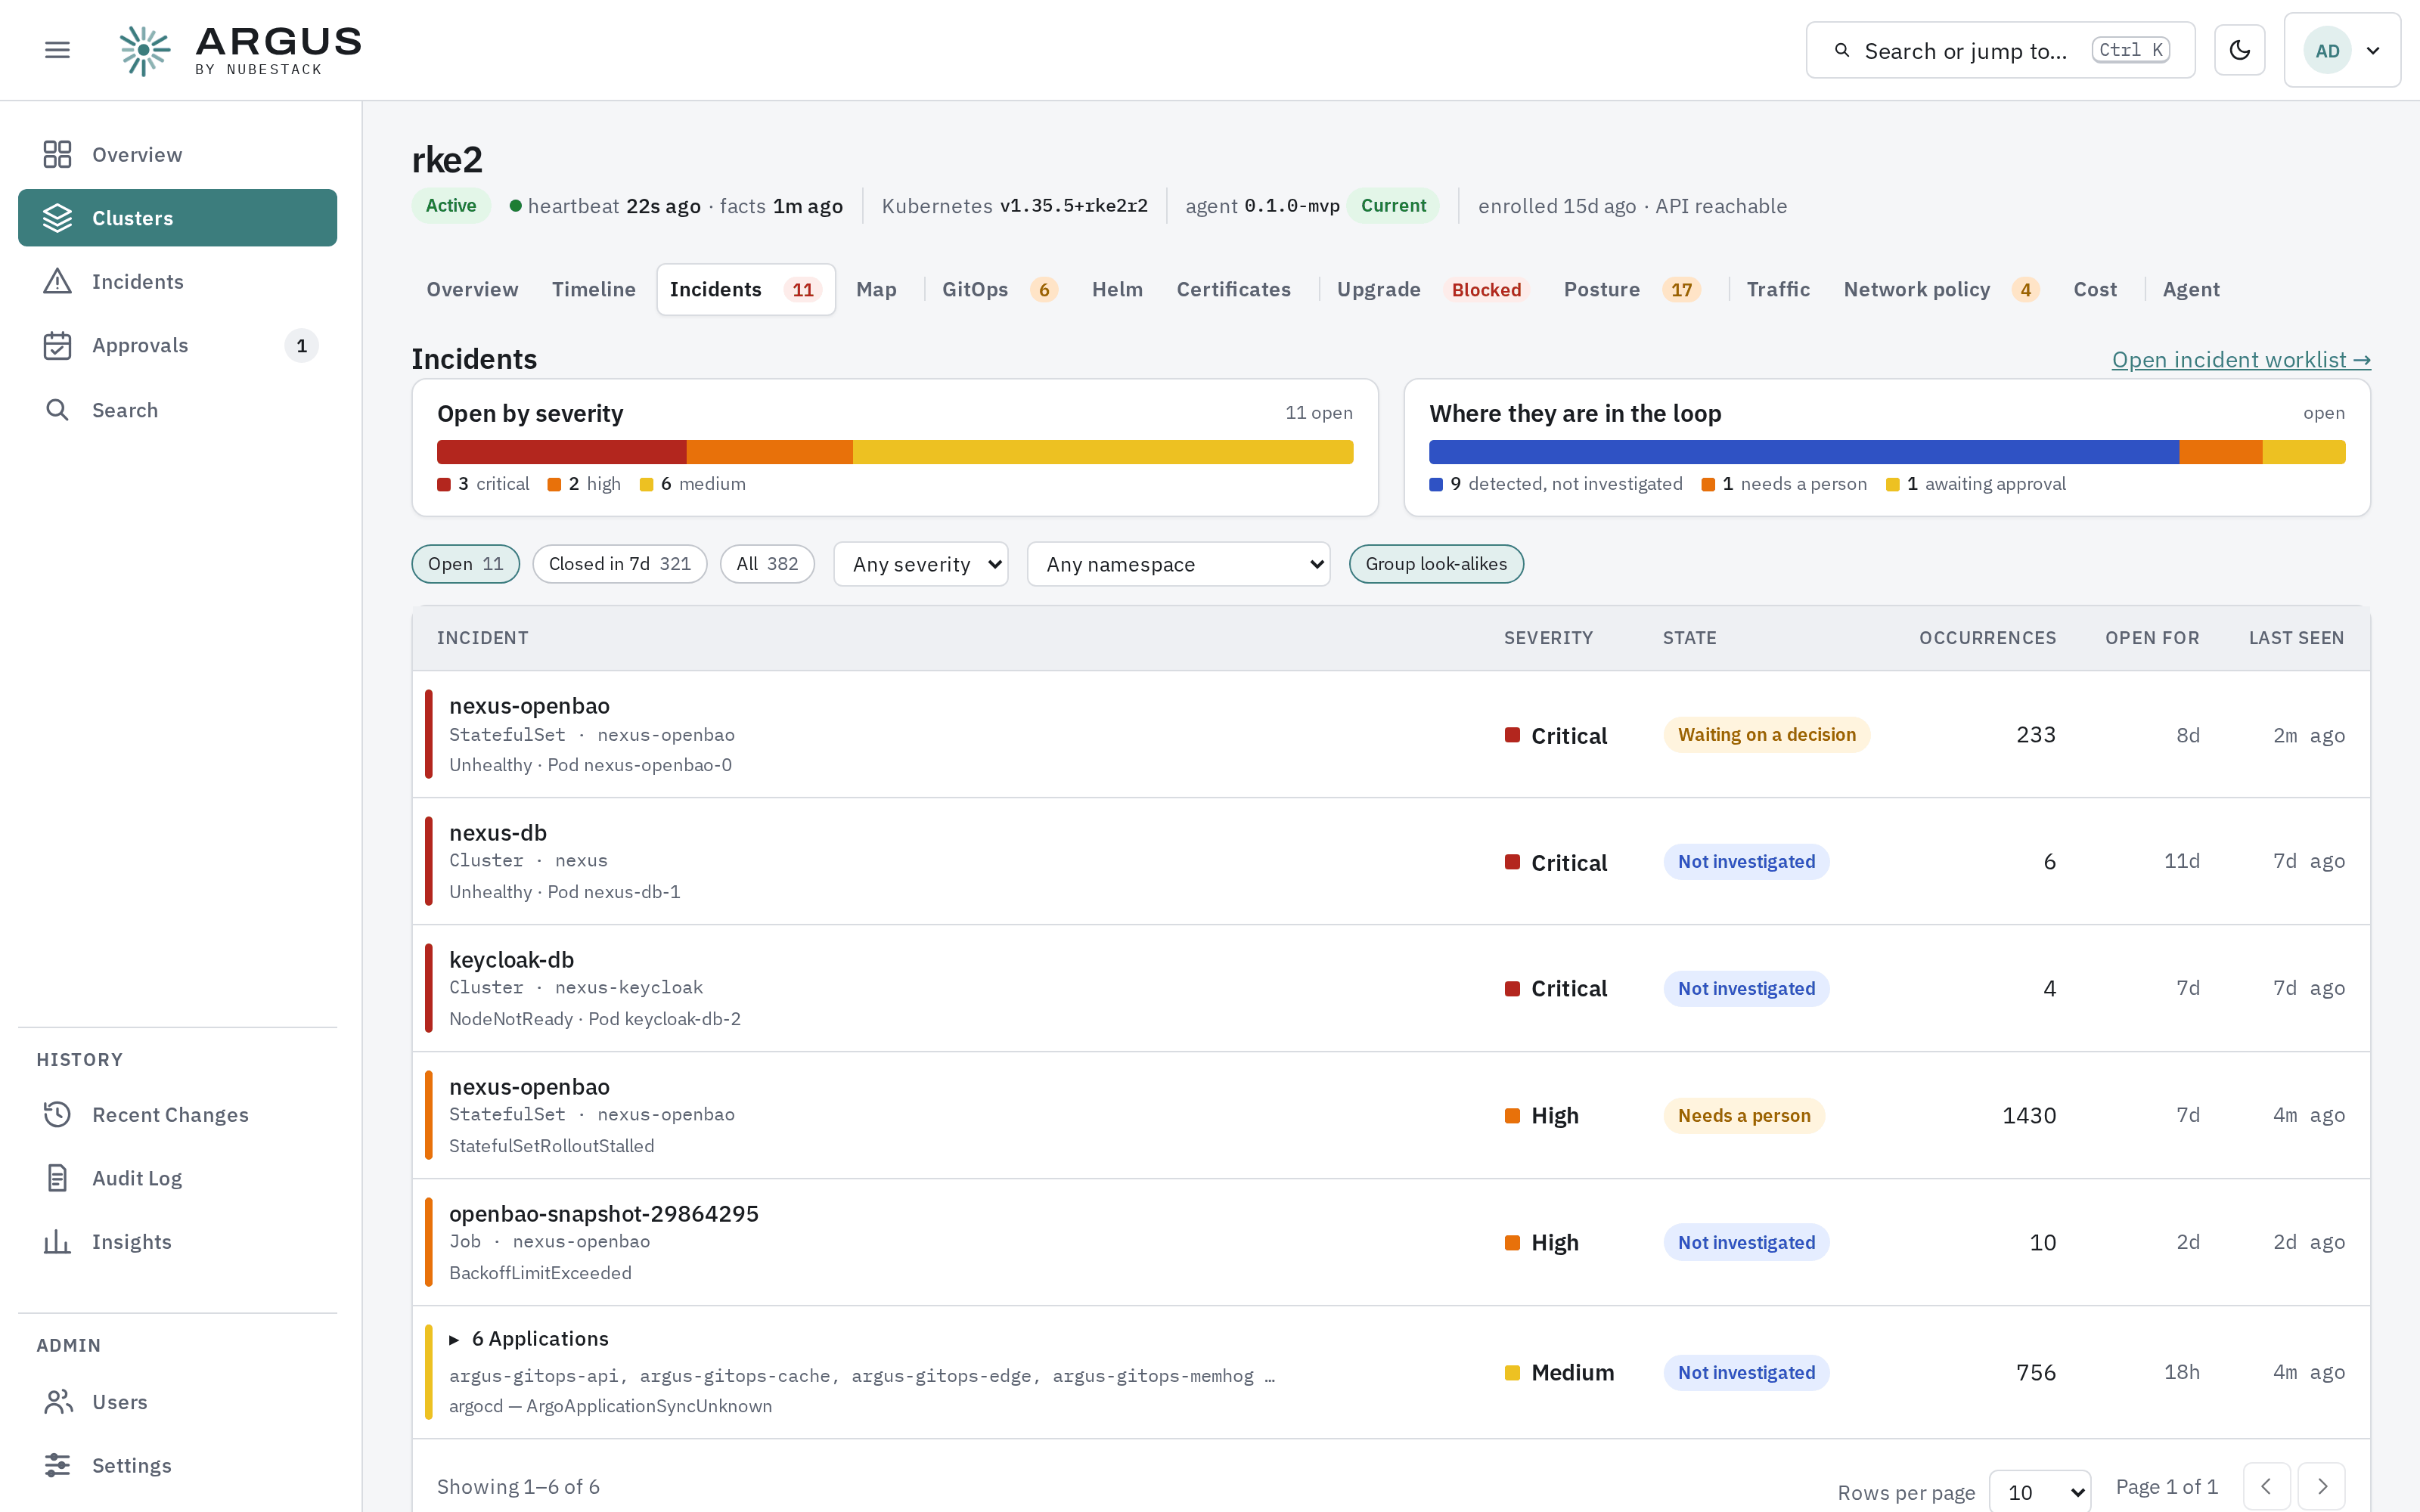
This cluster's incidents, with the open set split by severity and by where each incident is in the lifecycle. Look-alike incidents — the same fault on many pods — are grouped into one row. Open incident worklist opens the full incident list narrowed to this cluster.
Agent
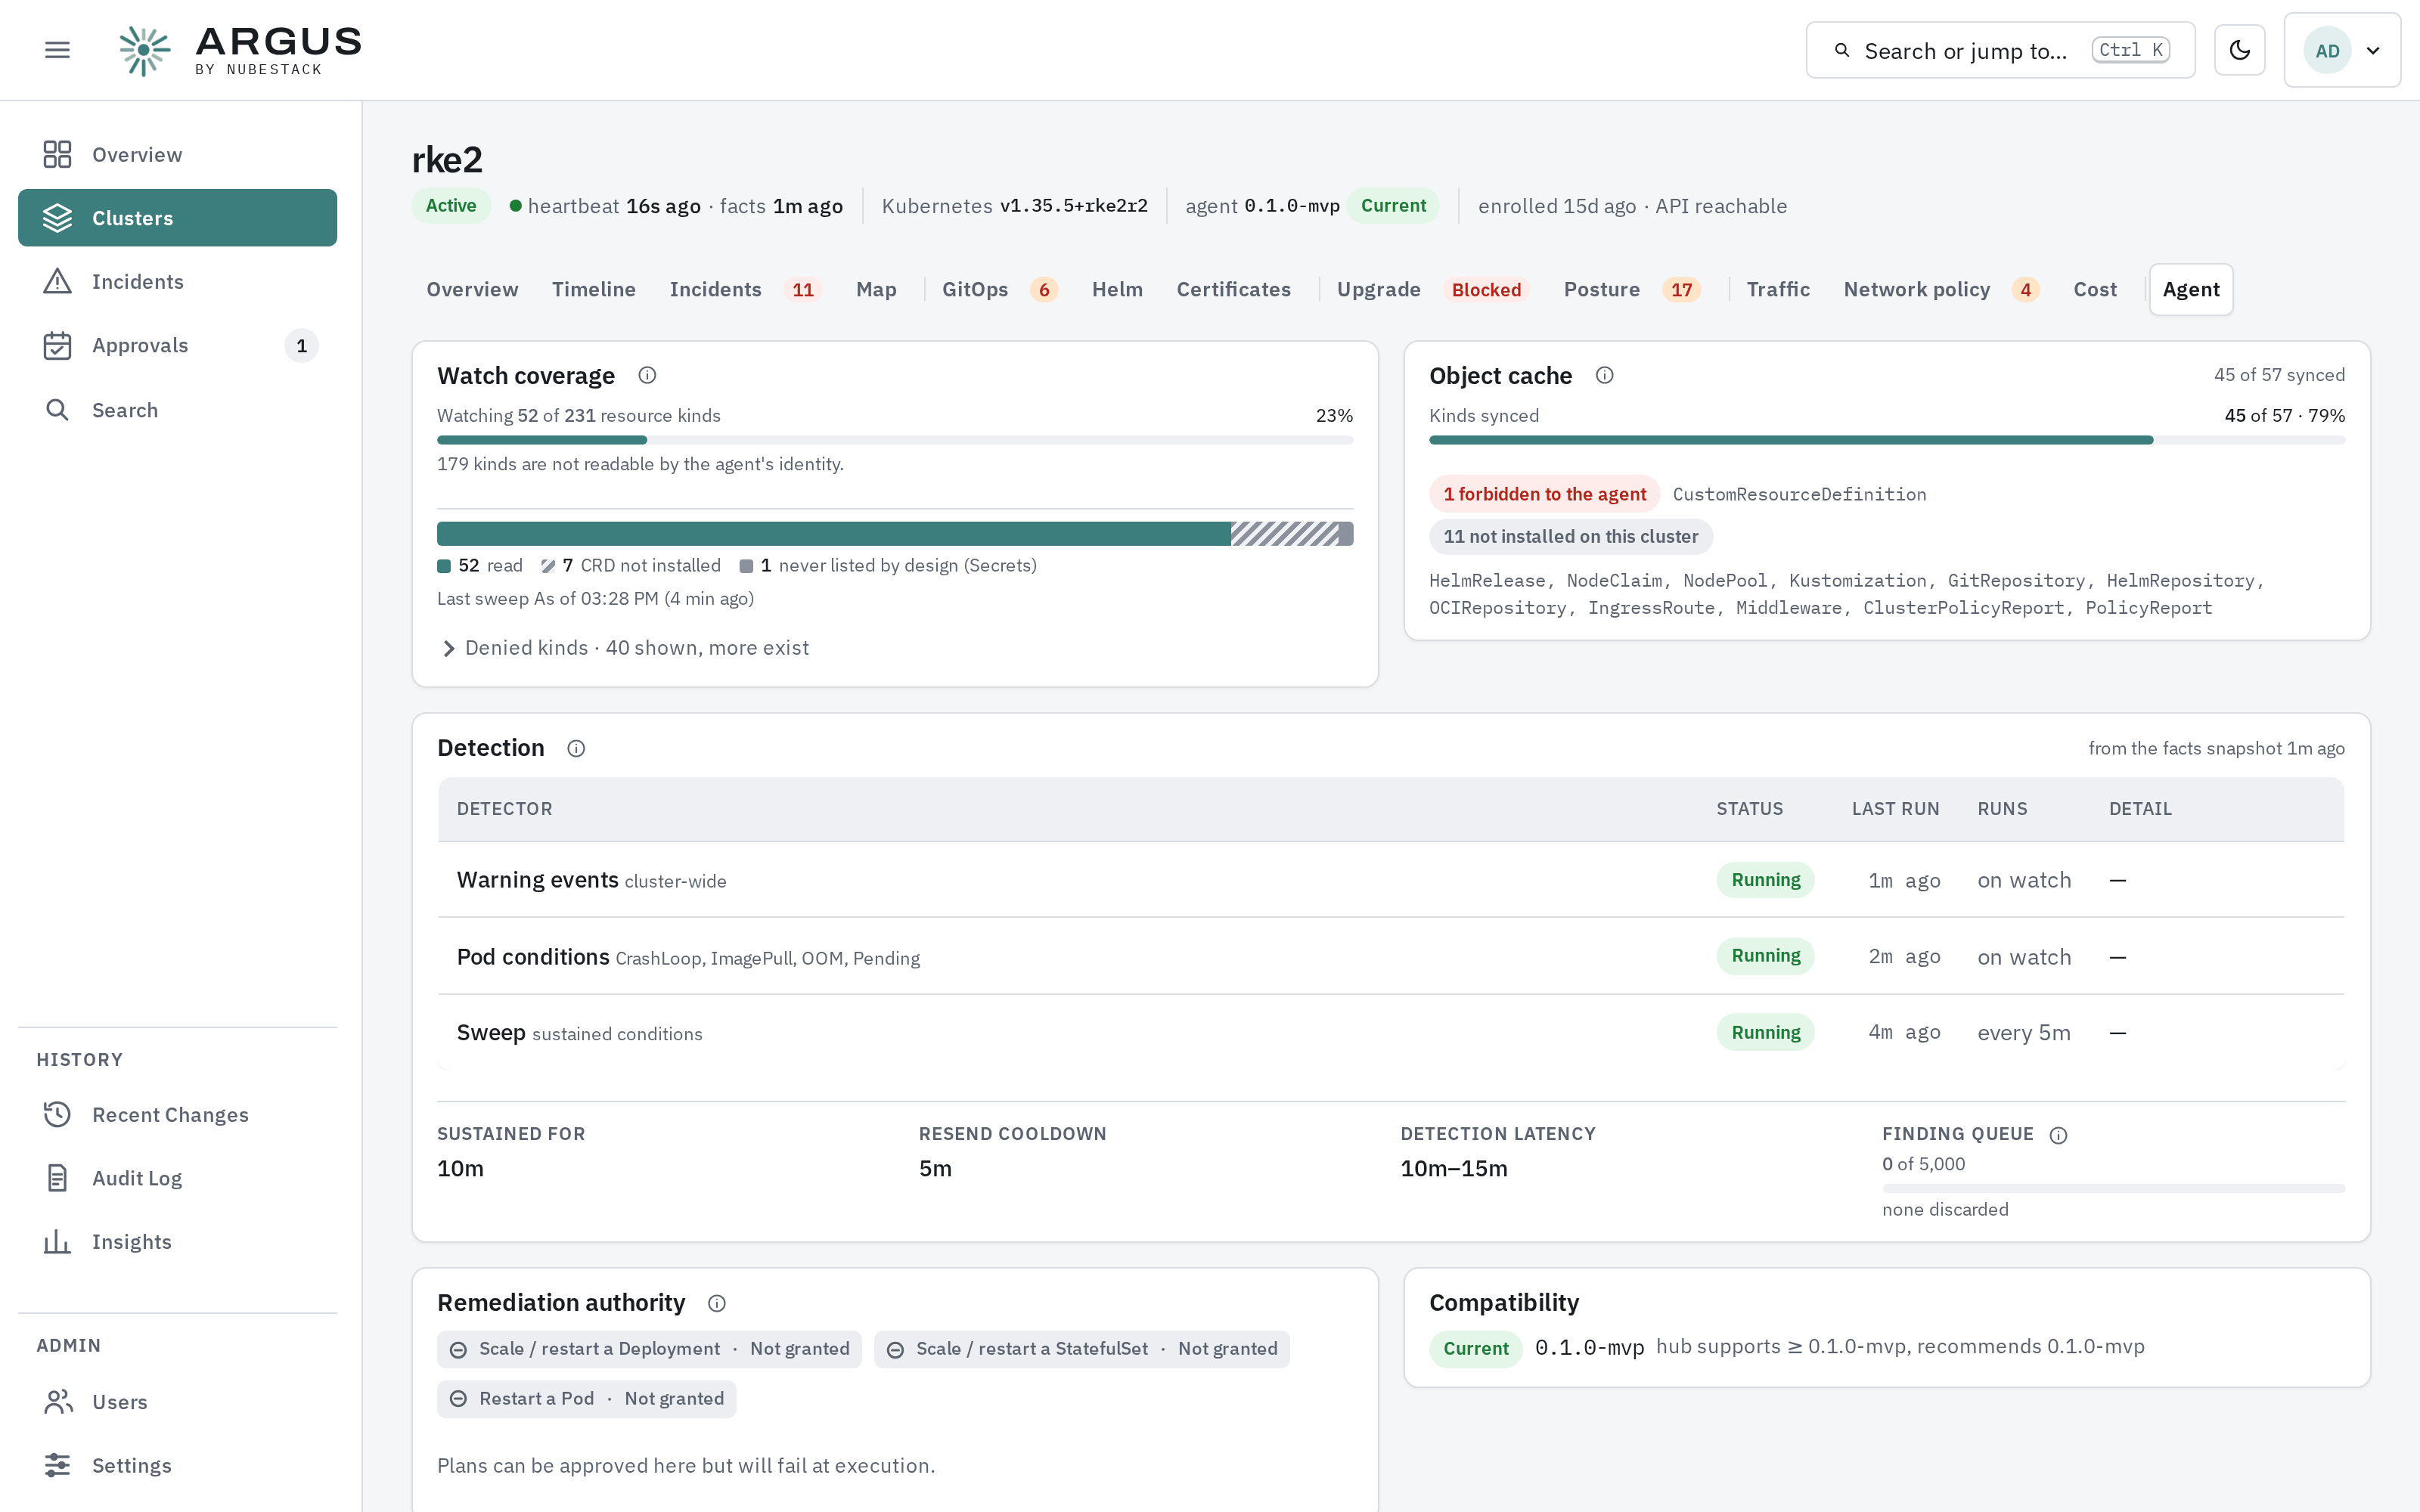
What the agent can see, how its detectors are running, and what it may change.
| Card | Shows |
|---|---|
| Watch coverage | How many resource kinds the agent watches, and which it cannot read |
| Object cache | Which kinds are synced, forbidden or not installed. Kinds that are not installed or not readable are looked up again every few minutes, so installing a controller or granting a read later needs no agent restart |
| Detection | Each detector's status and last run, the sustain period, resend cooldown, detection latency and finding queue |
| Remediation authority | Each write action and whether the agent holds it — discovered by asking the cluster, not taken from configuration |
| Metrics source | Whether the agent can query Prometheus, in-cluster or an external endpoint. When none is configured, the Prometheus, Thanos or VictoriaMetrics Service it found, with the chart values to set. An external endpoint is marked Not scoped to this cluster when no extraLabel is set, and Label not enforced when one is set but the endpoint returned series outside it, as plain Prometheus and Thanos do |
| Compatibility | Whether this agent version is supported by the hub, and the image it runs. When the hub ships a newer agent image and the chart allows it, Upgrade agent moves both agent Deployments onto it; otherwise the card shows the helm upgrade command |
Remediation authority is answered by the remediation identity itself, so it describes what an approved plan can actually change. It has three states: not reported (the agent predates the check), not answered (it asked and got no answer, which is not a denial) and a real per-action answer. With no remediation agent connected, the card says so. If an approval fails to execute, check here first.